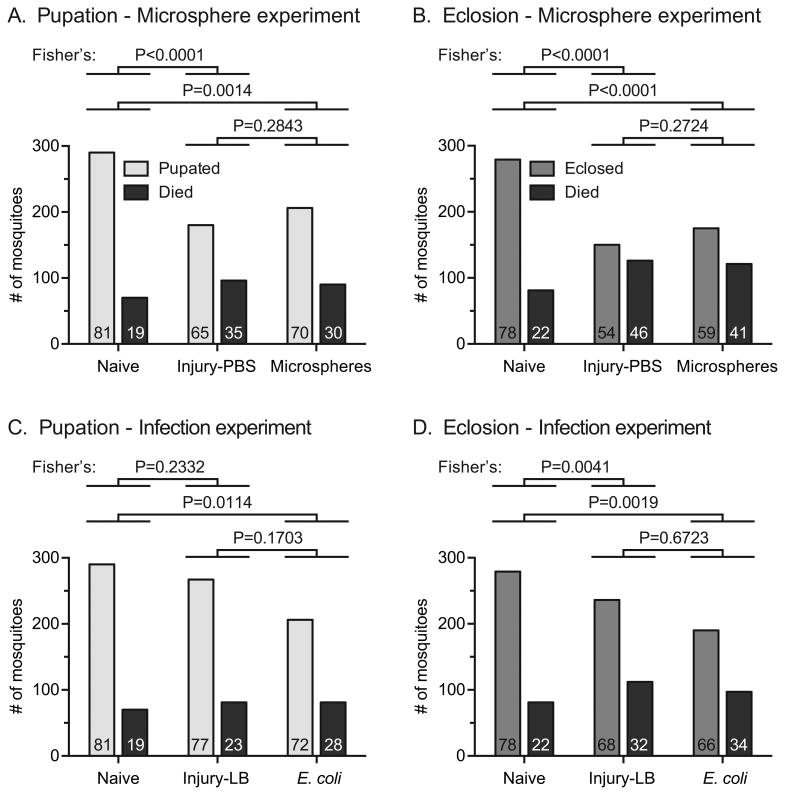
Figure 3.
Number of larvae that pupated, eclosed or died. A-B. Pupation (A) and eclosion (B) of untreated individuals (naïve), individuals injured as larvae by injection of PBS, and individuals immune-stimulated as larvae by injection of microspheres. C-D. Pupation (C) and eclosion (D) of untreated individuals (naïve), individuals injured as larvae by injection of LB, and individuals infected as larvae by injection of E. coli. The numbers at the bottom of each column indicate the percentage of mosquitoes for each outcome.

