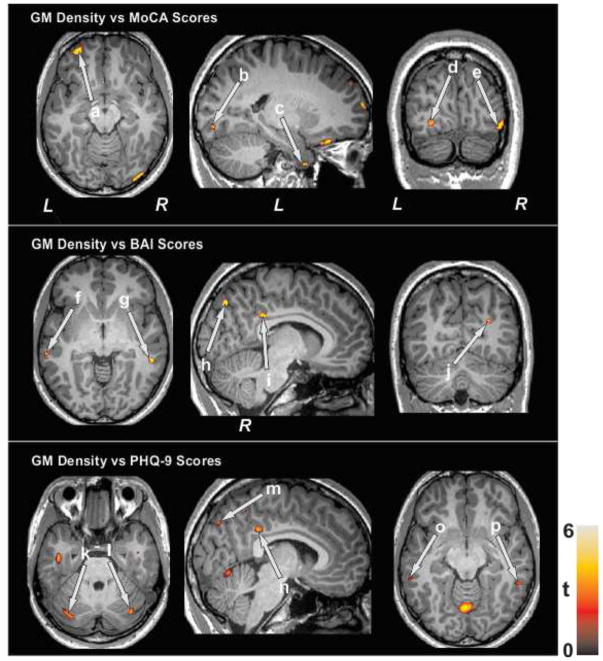
Figure 2.
The MoCA scores show positive correlations between regional brain gray mater density of the prefrontal cortices (a), occipital cortices (b, d, e), and temporal cortices (c) in SVHD subjects. The BAI values show negative correlations with brain areas including the temporal cortices (f, g), occipital cortices (h, j), and cingulate (i). The PHQ-9 scores show negative correlations with cerebellar cortices (k, l), occipital cortices (m), cingulate (n), and temporal cortices (o, p) in SVHD subjects.

