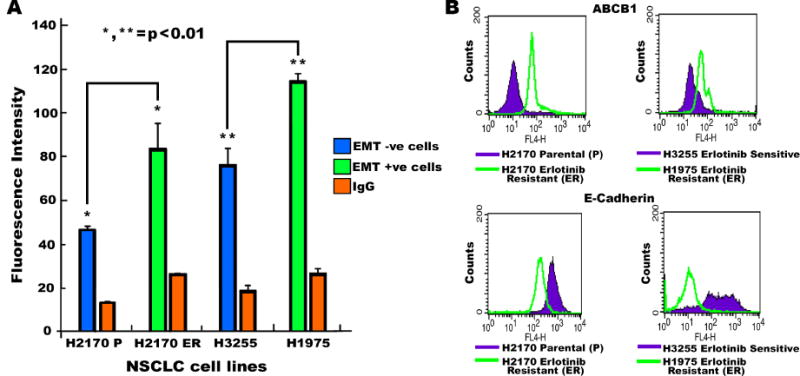
Fig. 4.

(A) 5×10⁵ cells were plated and grown in 100mm dishes for 48 hours. Cells were then collected using Accutase media and probed with FITC-CD243 (ABCB1). The pellet was then washed and resuspended in flow cytometry buffer (PBS with 0.5% BSA and 5mM EDTA). An equal number of cells were analyzed, and a bar graph was generated in order to plot fluorescence intensity. (B) After analyzing equal numbers of cells by flow cytometry, a histogram for fluorescence intensity was plotted using CellQuest software. H2170-P and H2170-ER cells were compared. H3255 Erlotinib-sensitive and H1975-ER cells were also compared for expression of ABCB1 and E-cadherin.
