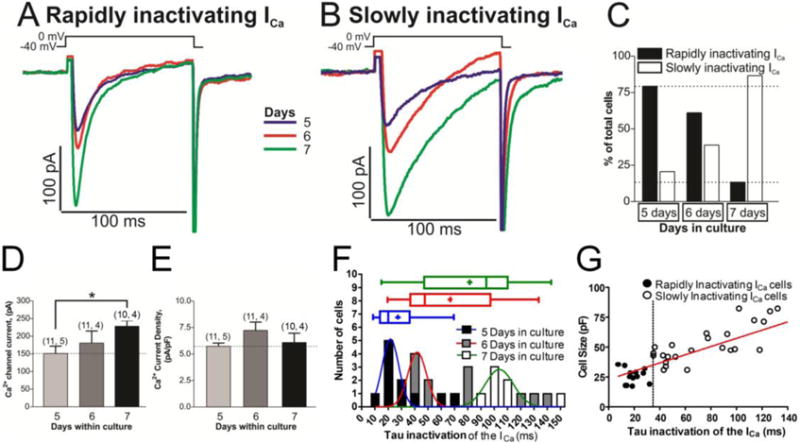
Fig. 1. Two different time dependent kinetics of L-type calcium channels are expressed in cultured rN-CM.

Panels A and B show examples of original traces of calcium currents obtained from different rN-CMs with variable ages in culture (5–7 days), activated by depolarization from −40 mV to 0 mV, exhibiting different rates of inactivation: Rapidly inactivating ICa (Panel A) and slowly inactivating ICa (Panel B). Panel C shows a plot of the cell percentages that presented rapidly or slowly inactivating ICa vs. the age of the cells in culture. Panel D and E plotted the average values of ICa and the Ca2+ current density respectively vs. the time of the cells in culture (5–7 days). Panel F provide frequency histograms and box and whiskers plots showing the distribution of the inactivation time constant of the ICa (τ) at the tree different time in culture (5, 6 and 7 days). The data were pooled in such a way that the number of observations with 0.00 ms ≤ τi < 10.00 ms were plotted in the column τi = 10 ms. The data were fitted to a Normal Distribution with three different colors Gauss curve represented (blue, red or green for rN-CMs with 5, 6 or 7 days in culture respectively). Data distribution are presented also in box-and-whiskers plots: the line inside the box depicts median values, the size of the box is given by the distance between the 25th and the 75th percentiles; upper “whisker” reach the 90th percentile and lower “whisker” the percentile 10th. Means are also represented inside the box with a cross symbol. Panel G shows a scatter-gram of cell size (pF) vs. inactivation time constant (τi) from rN-CMs with rapidly (●) and slowly (○) inactivating ICa, rN-CMs were classified as expressing rapidly- (τi ≤ 35 ms) or slowly-inactivating (τi > 35 ms) L-type Ca2+ channels.
