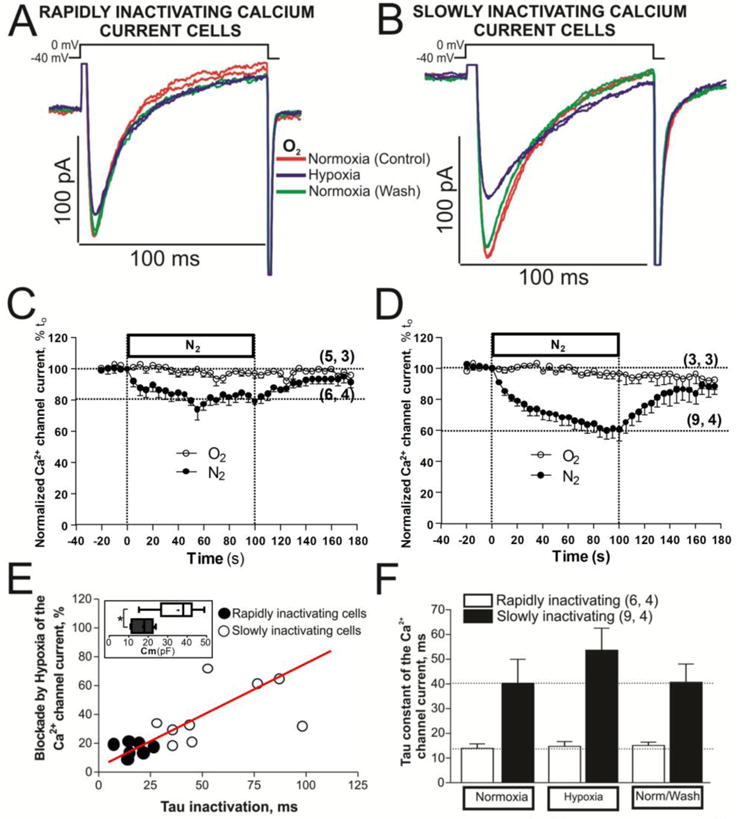
Fig. 3. Acute hypoxia differentially affects to the neonatal cardiomyocytes with rapidly or slowly inactivating ICa.

Panels A and B show examples of original traces of calcium currents obtained from two different rN-CMs, activated by depolarization from −40 mV to 0 mV, exhibiting different rates of inactivation as well as differing degrees of suppression during acute hypoxia (purple traces). Panels C and D display time courses of suppression of ICa during 2 minutes of hypoxia stimulus (N2 top bar with filled circles) in rN-CMs with rapidly and slowly inactivating ICa, respectively. Time courses with open circles represent a set of rN-CMs under normoxic condition during 200 seconds. Panel E shows a scatter-gram of hypoxic suppression of ICa vs. inactivation time constant (τ) from rN-CMs with rapidly (●) and slowly (○) inactivating ICa. Box and whiskers plots inscribed in the panel E show the distribution of the sell size for the rapidly (black box) and slowly (white box) inactivating rN-CMs. Panel F plotted the average τ values of ICa before, during, and after exposure to hypoxia for each of the two cell types.
