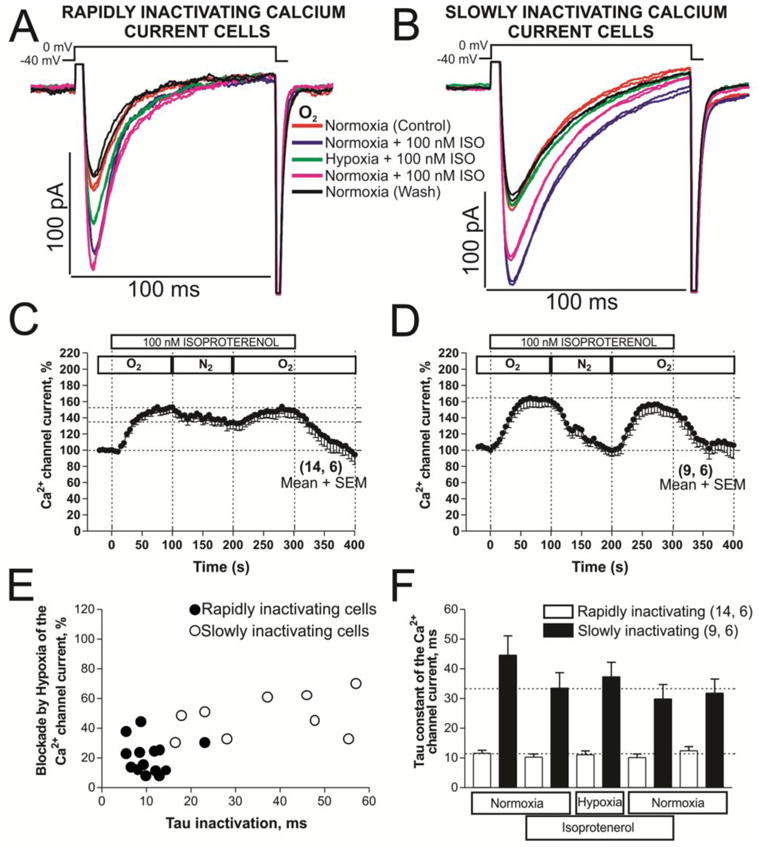
Fig. 4. Phosphorylation effects of isoproterenol (ISO) on calcium channels of rN-CMs with rapidly or slowly inactivating ICa in normoxia and hypoxia conditions.

Panels A and B show examples of original traces of rapidly and slowly inactivating ICa respectively, obtained from two different rN-CMs, activated by depolarization from −40 mV to 0 mV and exposed to the following consecutive treatments: 1) red traces, normoxia control condition; 2) purple traces, initial treatment with 100 nM ISO in normoxia; 3) green traces, shift to the hypoxic condition maintaining the ISO treatment; 4) pink traces, return to the condition described in 2); 5) black traces, back to the initial normoxia control condition without ISO. Panels C and D displayed time courses (in rN-CMs with rapidly and slowly inactivating ICa, respectively) of modulation of ICa by ISO perfused during 5 minutes (ISO bar) at the consecutives conditions of normoxia, hypoxia, and normoxia washout represented by the sequence of O2, N2, and O2 top bars, respectively. Panel E shows a scatter-gram of hypoxic suppression of ICa vs. inactivation time constant (τ) from rN-CMs with rapidly (●) and slowly (○) inactivating ICa. Panel F plotted the average τ values of ICa before, during and after exposure to ISO and hypoxia for each of the two cell types.
