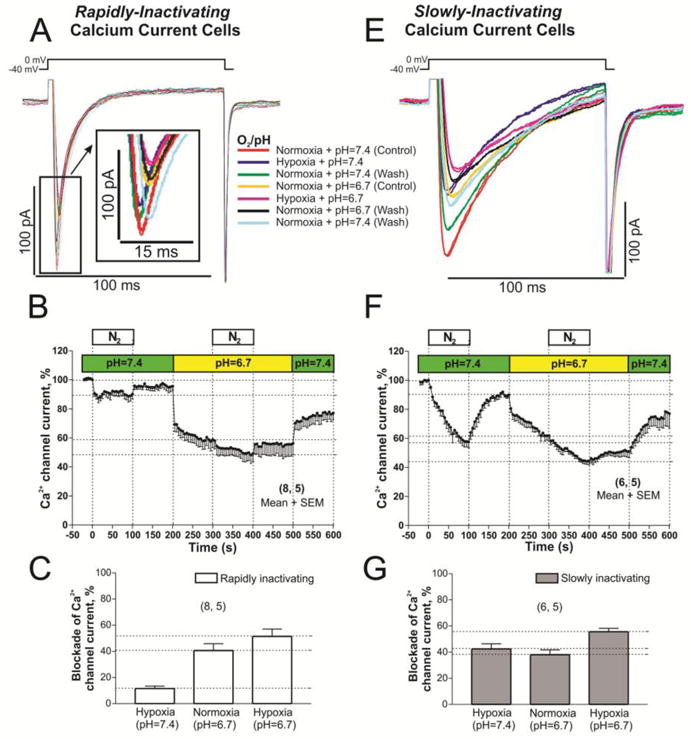
Fig. 6. L-type Ca2+ channel is differentially blocked in rN-CMs with rapidly or slowly inactivating ICa when the stimulus of acute hypoxia and acidification are combined.

Panels A and E show examples of original traces of rapidly and slowly inactivating ICa respectively, obtained from two different rN-CMs, activated by depolarization from −40 mV to 0 mV and exposed to the following consecutive treatments: 1) red traces, normoxia and pH (7.4) control condition; 2) purple traces, hypoxia and control pH 7.4; 3) green traces, back to the initial control treatment (normoxia and pH 7.4); 4) yellow traces, normoxia and low pH 6.7; 5) pink traces, hypoxia and low pH; 6) black traces, again back to normoxia and low pH; 7) blue traces, washout period to normoxia and pH 7.4. Panels B and F displayed time courses (in rN-CMs with rapidly and slowly inactivating ICa respectively) of the ICa suppression by low pH (pH=6.7 bar) and/or hypoxia (N2 bar). Panels C and G plotted the average of ICa blockade values by hypoxia, low pH, and both stimulus together.
