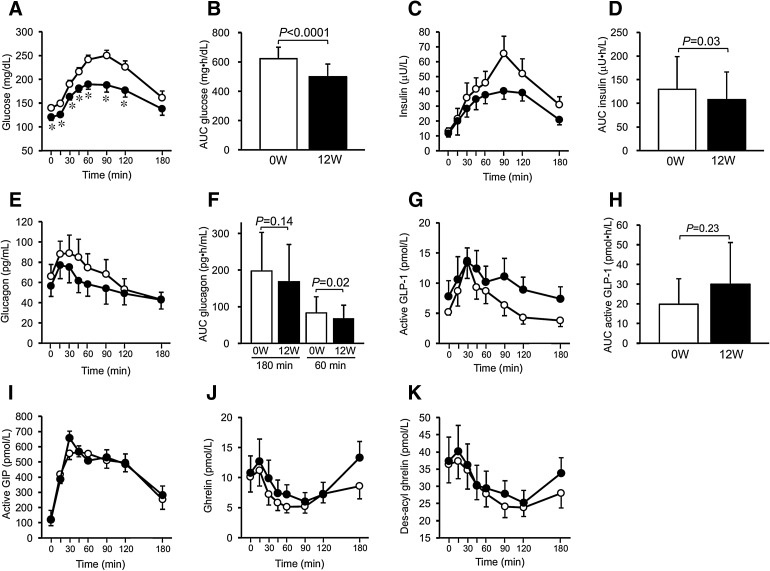
Fig. 1.
Effects of ipragliflozin on glucose metabolism and gut peptides in the meal tolerance test. The changes are shown for a plasma glucose (before vs. after, P < 0.0001), b glucose AUC0–180, c insulin (before vs. after, P = 0.042), d insulin AUC0–180, e plasma glucagon (before vs. after, P = 0.096), f glucagon AUC0–180 and AUC0–60, g active GLP-1 (before vs. after, P = 0.28), h active GLP-1 AUC0–180, i active GIP (before vs. after, P = 0.78), j ghrelin (before vs. after, P = 0.35), and k des-acyl ghrelin (before vs. after, P = 0.28). Open and closed circles indicate before and after 12 weeks of ipragliflozin administration, respectively. *P < 0.05 vs. before ipragliflozin administration

