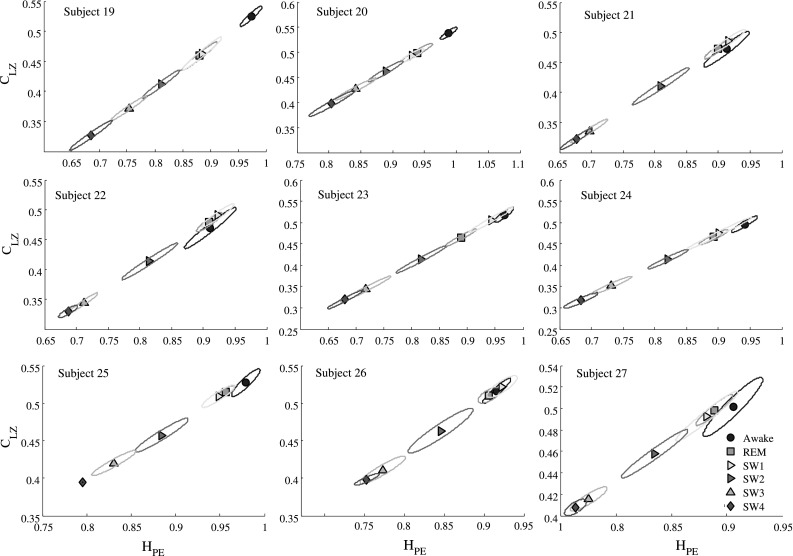
Fig. 4.

PLZC versus HPE analysis belong to 9 sleep subject in 6 different sleep stage (Awake, REM, Sws1, Sws2, Sws3, Sws4). The signal was recording in the Fpz-Cz channel over all night. The dots and the ellipses represent the mean values and the correlation error matrix over each state. The awake stage have the higher values and decreasing as that subject goes into the deeper sleep states. The parameter used were and , same result were found for
