Figure 3.
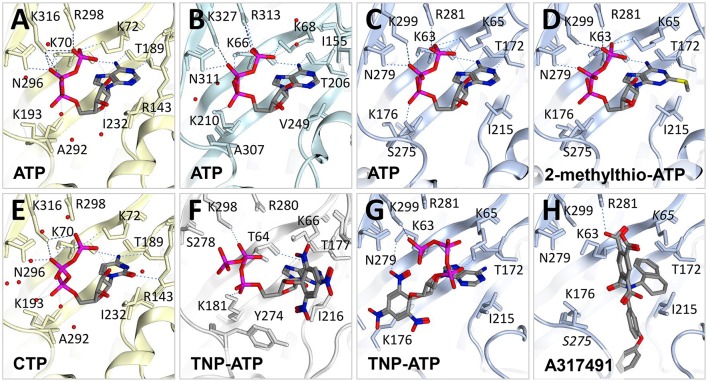
Molecular determinants of orthosteric binding. Crystal structures of zebrafish P2X4 (light yellow ribbon) bound to (A) ATP (PDB ID: 4DW1) and (E) CTP (5WZY). Water molecules are shown as red dots. (B) Gulf coast tick crystal structure (in light cyan ribbon) in the presence of ATP (5F1C). Human P2X3 crystal structures (light blue ribbon) bound to (C) ATP (5SVK), (D) 2-methylthio-ATP (5SVP), (G) TNP-ATP (5SVQ) and (H) A317491 (5SVR). (F) Crystal structure of chicken P2X7 (gray ribbon) in the presence of TNP-ATP (5XW6). H-bond interactions are displayed with dotted lines. Only residues in close proximity to the ligand are labeled. Note that crystal structure data relative to the ATP binding site is incomplete in (G) where the loop containing S275 is missing from the PDB file and in (F) where K65 and S275 (labeled in italics) have missing atoms. Figures were made using Molecular Operating Environment (MOE).

