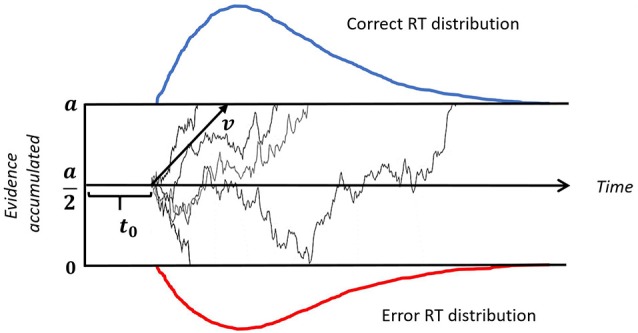
Figure 2.

Illustration of a drift-diffusion model. Thin black lines represent trajectories of individual random walks. Each walk captures noisy accumulation of evidence in time on a single trial. The speed of accumulation is determined by the drift-rate (v). A response is initiated when either of the boundaries (a or 0) is reached. The upper (blue) and lower (red) panels represent reaction time (RT) distributions for correct and incorrect responses, respectively. The time gap between the onset of a stimulus and start of the evidence accumulation is non-decision time, denoted by t0.
