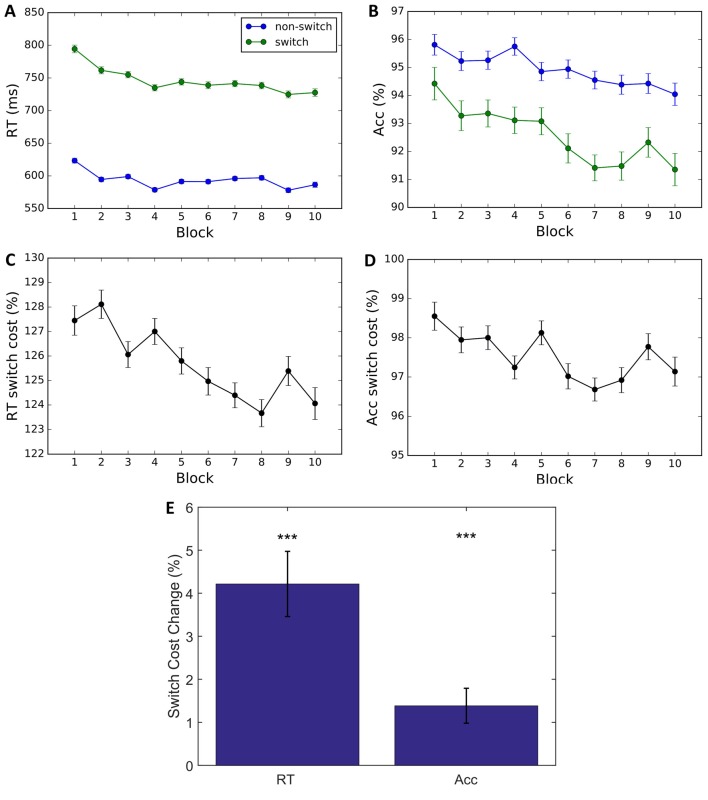
Figure 3.
Behavioral data. (A,B) Average RT and percent correct by block. Results indicate a decrease in Average RT and Accuracy for switch and non-switch trials. (C,D) Switch cost is calculated by dividing switch by non-switch performance. A larger decrease in switch trials is reflected in a reduction in switch cost RT and switch cost accuracy. (E) Switch cost change is calculated by subtracting Block 10 performance from Block 1. The bar plots indicate that change in RT and accuracy switch costs are significantly greater than 0. Error bars represent within-subject errors. ***p < 0.001.

