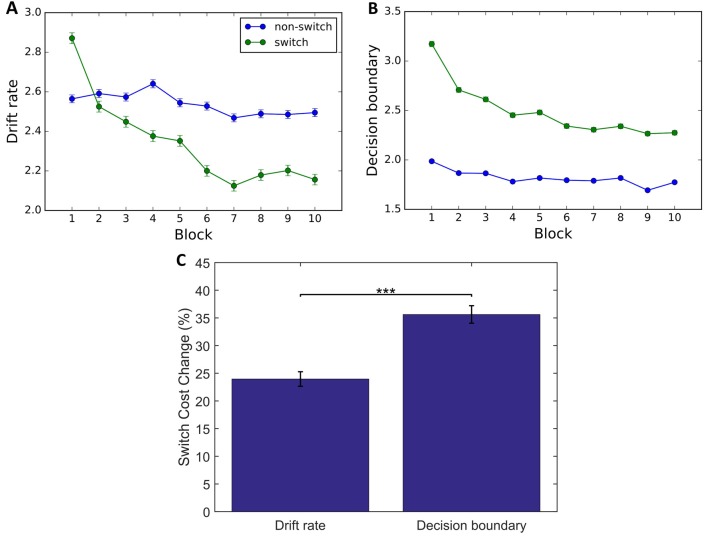
Figure 6.
Drift diffusion model (DDM) data. Group level parameters for all participants (n = 305) for switch trials (green) and non-switch trials (blue). (A,B) Results indicate a decrease in drift rate (A) and decision boundary (B). (C) A larger change in decision boundary than in drift rate from blocks 1 to 10 indicates that the decrease in RT and Accuracy is driven by a decrease in decision boundary. Error bars represent within-subject errors. ***p < 0.001.

