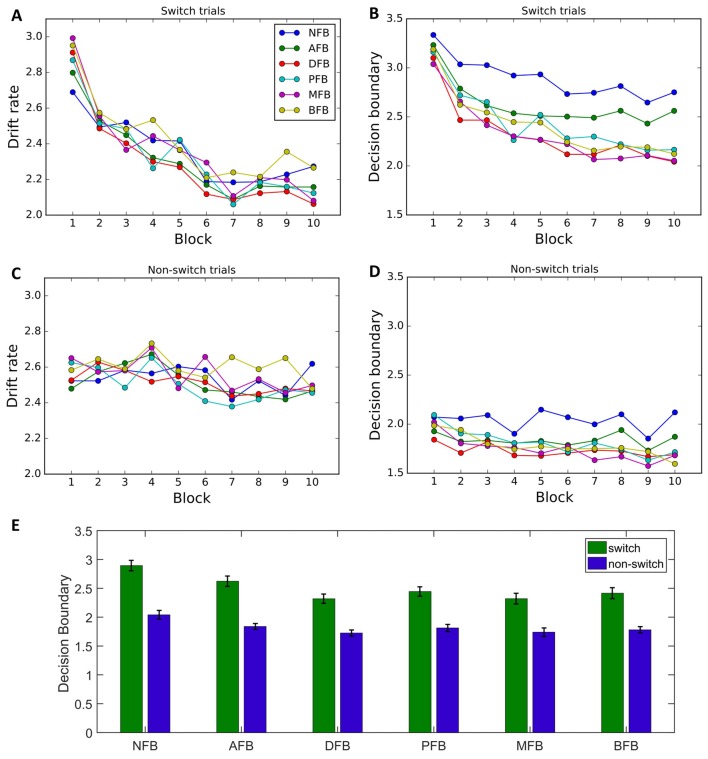
Figure 7.
DDM data by condition. (A–D) Group level parameters for each feedback condition for switch trials and non-switch trials, drift rate, decision boundary. Results indicate that behavioral changes by condition are primarily due to differences in decision boundary. (E) Decision boundary by condition and trial type. Results indicate an overall decrease in decision boundary as feedback motivates good performance on switch trials, with the decrease being driven by the switch trial boundary. Error bars represent within-subject errors.

