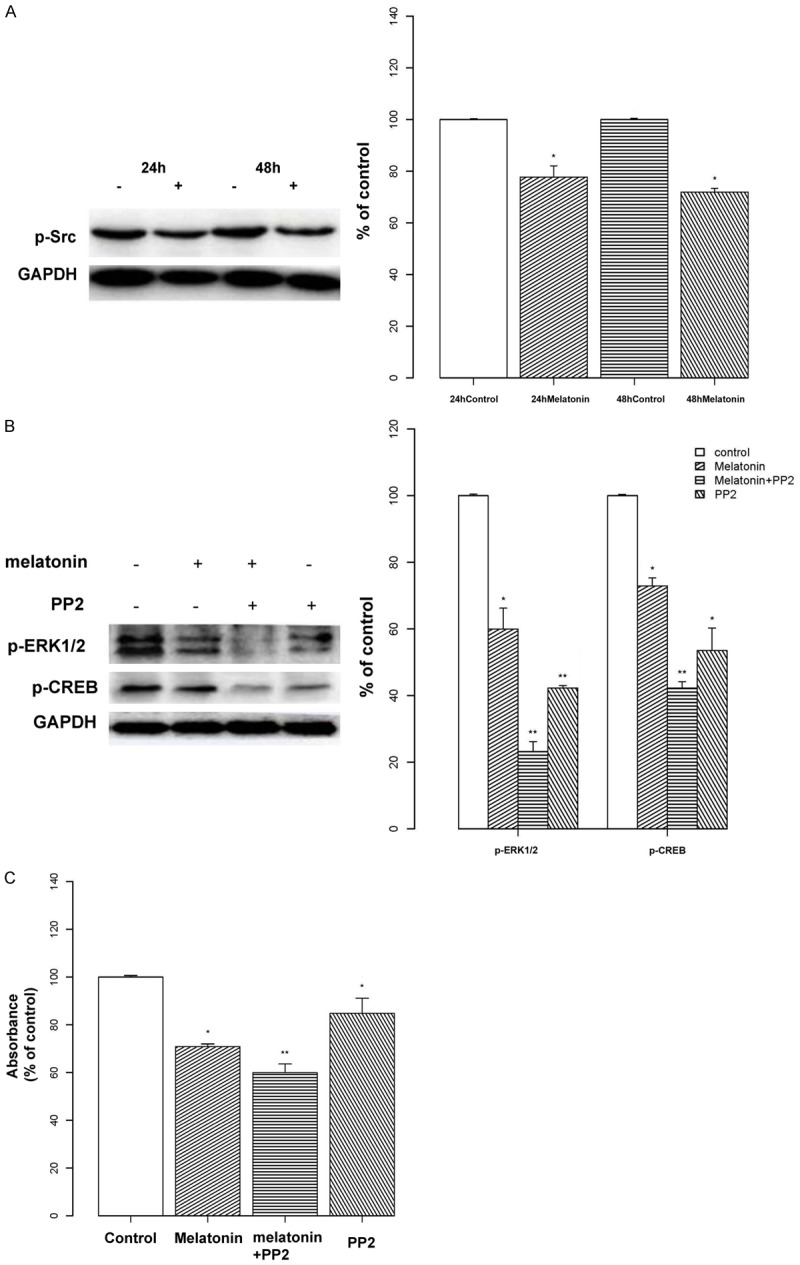
Figure 5.

Relationship between Src and the ERK/CREB Pathway. A: Osteoblasts were treated with melatonin (2 mM) for 24 or 48 h and the expression of phosphorylated Src was analyzed by Western blotting. Protein levels were analyzed and normalized to the corresponding GAPDH band. Results are shown as the percent optical density relative to the respective control time point (24 or 48 h). Melatonin decreased the expression of phosphorylated Src in osteoblast cells. Protein levels were normalized to the corresponding GAPDH band. B: Osteoblast cells were treated with melatonin (2 mM; indicated by “+”) or the Src inhibitor PP2 (20 μM; indicated by “+”) alone, or in combination. Expression levels of p-ERK and p-CREB were analyzed by Western blotting. Protein levels were analyzed and normalized to the corresponding GAPDH band, and the results are shown as the percent optical density relative to the respective control (untreated) for each protein. Expression levels of p-ERK and p-CREB were remarkably reduced in the melatonin-treated group, and this effect was more pronounced in the melatonin + PP2 group. C: Osteoblast cells were treated with melatonin (2 mM) and/or PP2 (20 μM) for 24 h. Cell proliferation was assessed with a MTT assay, and the results are displayed as the percent absorbance at 490 nm relative to controls (untreated). All experiments were performed in triplicate and data are shown as the mean ± S.E.M. *P < 0.05 or **P < 0.01, compared to controls.
