
Figure 3.
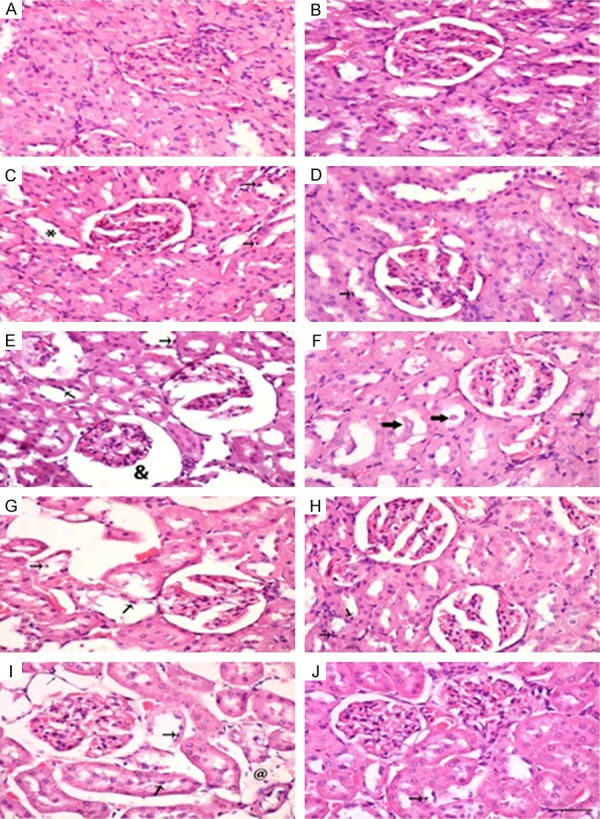
Hematoxylin and Eosin staining of renal tissues of control (Con) rats and rats treated with different doses of KBrO3 (PB) with or without gum acacia (GA). Different sections in the figure represent the following groups: (A) Con; (B) GA; (C) PB 5 mg/kg; (D) PB 5 mg/kg plus GA; (E) PB 15 mg/kg; (F) PB 15 mg/kg plus GA; (G) PB 45 mg/kg; (H) PB 45 mg/kg plus GA; (I) PB 135 mg/kg; and (J) PB 135 mg/kg plus GA. Sections (A, B and D) showed normal kidney histological appearance. Section (C) showed minimal histopathological degeneration. ‘*’ indicate dilated tubule. Sections (E, G and I) showed apoptotic cells (thick arrow), and necrotic tubule ‘@’. Partial ameliorations in necrotic and degenerative field were seen in sections (F, H and J) (thick arrows: tubular cast; thin arrows: apoptotic cells). (×400; Bars: 65 µm).