
Figure 3.
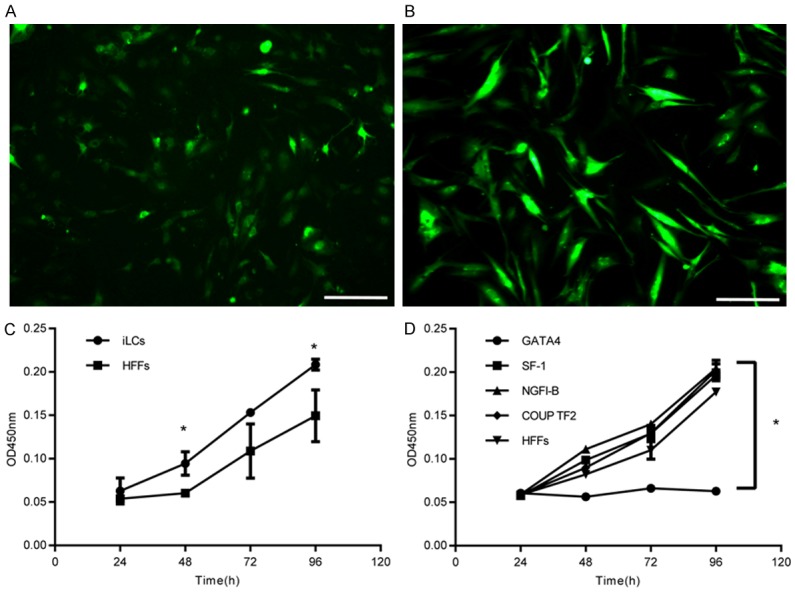
The morphology of iLCs under the microscope and the growth rate. (A) iLCs of 2 weeks under the fluorescence microscope. (B) HFFs transfected with GFP at 2 weeks after transfection. Scale bars in (A and B) represent 200 µm. (C and D) Cell growth assay at day 3 after transfection. Data represent mean ± SD of triplicate experiments. *P < 0.05 as compared with the group of HFFs. iLCs refers to the 4TFs group; HFFs refers to the control group; and GATA4, SF-1, NGFI-B, and COUP TF2, respectively, refer to removing each of the 4 TFs.