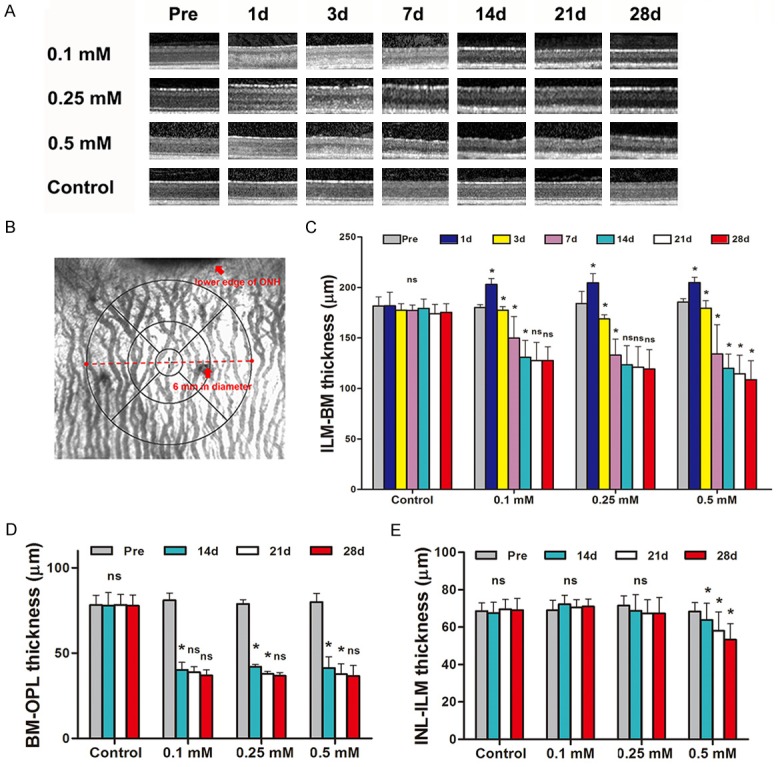
Figure 2.

SD-OCT showed gradual decrease of retina thickness of rabbits after SNP treatment. A. Example of SD-OCT images of posterior pole of rabbits’ retina over 28-day observation period. The retinal edemas were observed at D1 post-injection, but soon decreased at D3 day post-injection, and then continue to decrease over time till D28. B. Example of fundus images showing the scope of retinal thickness at posterior pole measured by SD-OCT. C. The thickness from Bruch membrane (BM) to internal limiting membrane (ILM) were significantly decreased over 28-day period in 0.1 mM, 0.25 mM, 0.5 mM SNP groups while the control group has remained stable. Dose-dependent significantly differences were found among 0.1 mM, 0.25 mM, 0.5 mM SNP groups. D. The thickness from Bruch membrane (BM) to outer plexiform layer (OPL) were significantly decreased over 28-day period in 0.1 mM, 0.25 mM, 0.5 mM SNP groups and no differences was found among the three SNP groups. E. The thickness from inner nuclear layer (INL) to internal limiting membrane (ILM) were significantly decreased over 28-day period in 0.5 mM SNP groups and remained stable in 0.1 mM and 0.25 mM SNP group and control group. ns: no significance; *: P<0.05; All the ns and *represent the results compare with the previous time point.
