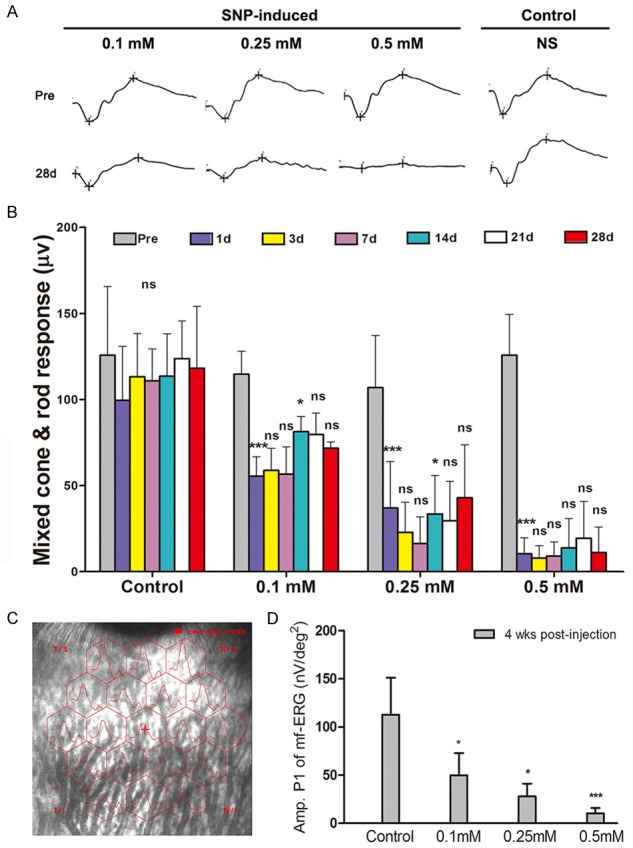
Figure 4.

Time-dependent changes in fERG and mfERG of the retina in New Zealand White rabbits. (A) Sample waveform of control group, 0.1 mM SNP injection group, 0.25 mM SNP injection group, and 0.5 mM SNP injection group pre- and 28 days post-injection. (B) The mixed cone & rod response change among control group, 0.1 mM SNP injection group, 0.25 mM SNP injection group, and 0.5 mM SNP injection group pre- and post-injection. The amplitude of mixed cone & rod response showed significantly dose-dependent decrease after SNP injection. (C) The sample graph of mf-ERG shows the specific site in the mfERG test. (D) The comparison of P1 amplitude among control group, 0.1 mM SNP injection group, 0.25 mM SNP injection group, and 0.5 mM SNP injection group at day 28 post-injection. The P1 amplitude showed significantly dose-dependent decrease after SNP injection. ns: no significance; *: P<0.05; **: P<0.01; ***: P<0.001; The ns and *in (B) part represent the results compare with the previous time point.
