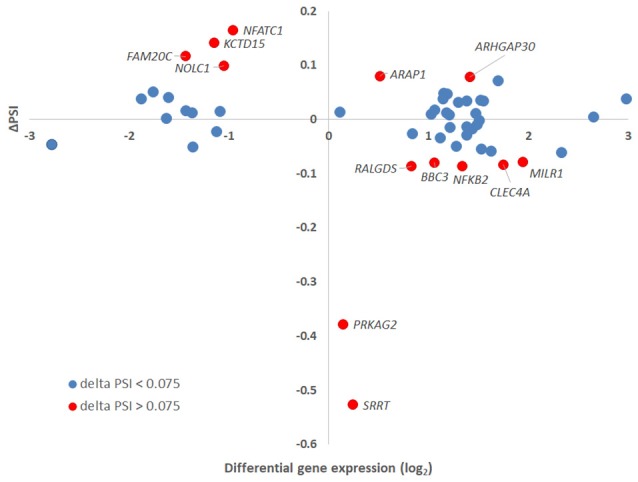
Figure 8.

Delta PSI and gene-level differential expression. The absolute values of PSI for isoforms assigned to a specific gene were plotted against the gene-level differential expression in A. phagocytophilum-infected vs. uninfected ATRA-differentiated HL-60 cells. Thirteen genes had ΔPSI greater than 7.5%, but only eight had gene-level differential expression greater or less than 2-fold. Of the three genes with the greatest ΔPSI, none had gene-level differential expression changes greater or less than 2-fold, but at least one isoform for each of these was expressed at 2-fold greater or 2-fold lower levels than in uninfected cells.
