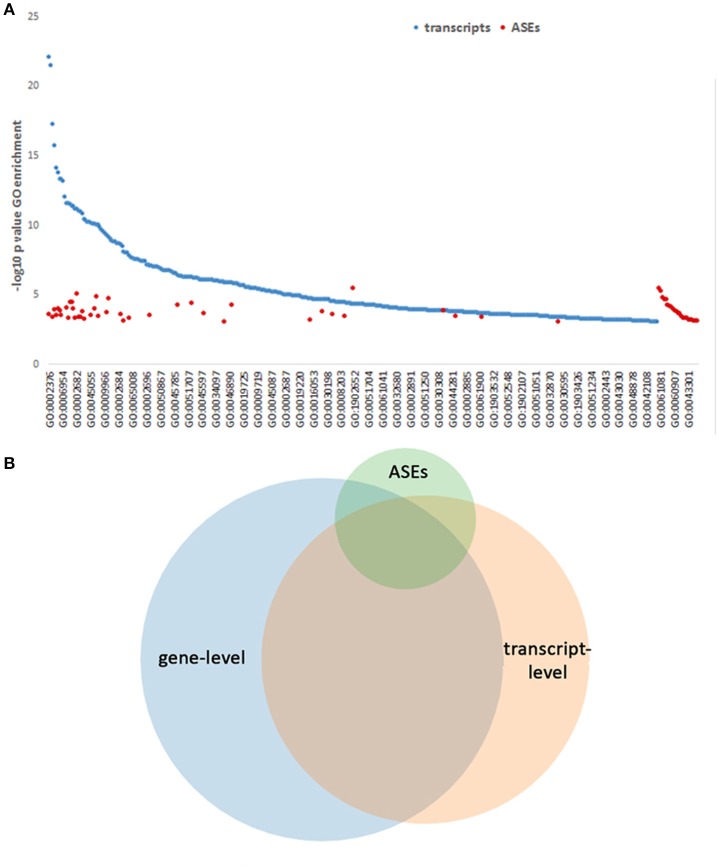
Figure 9.
GO Process predictions based on gene-level, transcript-level, and ASE analyses. GO Processes were queried and those with p-values < 0.001 for each of the above categories are displayed ranked by –log10 pval for display. (A) GO Processes identified by transcript analysis span a wide range, with some overlap of those GO Processes identified by ASE only analysis, which predicts additional pathways. The full list of GO processes represented on the x-axis is included in Table S2. (B) Venn diagram showing the overlapping GO Processes identified by gene-level, transcript-level, and ASE-level analyses, demonstrating a unique set of GO Processes associated with ASEs.

