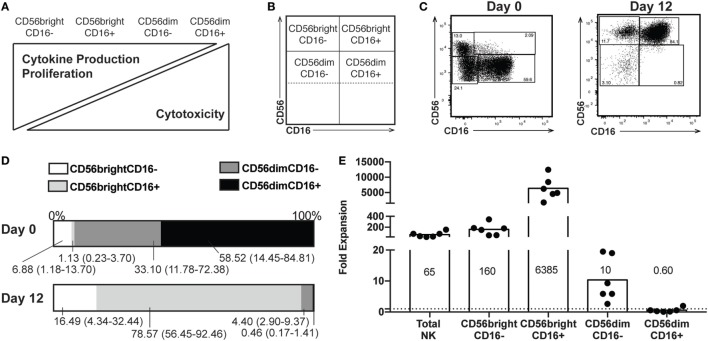
Figure 1.
Proportions of natural killer (NK) subsets following expansion. (A) Spectrum of NK functions and maturity based on expression of CD56 and CD16. (B) Representation of where subsets appear on flow plots of NK cells. (C) Distribution of CD56 and CD16 expression by NK cells from a representative donor before (day 0) and after (day 12) expansion. Percentage of NK cells in each subset is included in each gate. (D) Percentages of each subset at day 0 (top) and day 12 (bottom). Labels for each subset indicate a mean and range (n = 6). (E) Expansion of total NK cells and each subset on a per-cell basis. The mean fold change is indicated for each subset (n = 6).

