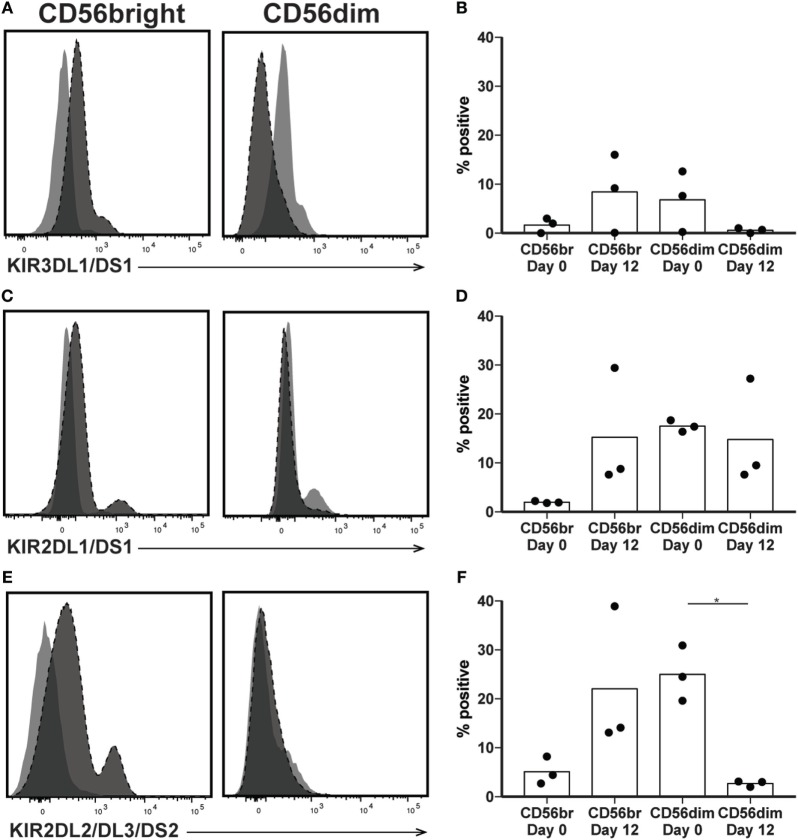
Figure 5.
Expression of killer immunoglobulin receptors following natural killer (NK) expansion. (A–F) Overlays of NK cells from a representative donor before (day 0) and after (day 12) expansion, by CD56bright (left) and CD56dim (right), for KIR3DL1/DS1 (A), KIR2DL1/DS1 (C), or KIR2DL2/DL3/DS2 (E). Quantification of percent cells positive at day 0 and day 12 for KIR3DL1/DS1 (B), KIR2DL1/DS1 (D), or KIR2DL2/DL3/DS2 (F). Statistical significance was assessed by one-way ANOVA (*p < 0.05, **p < 0.01, ***p < 0.001, and ****p < 0.0001).

