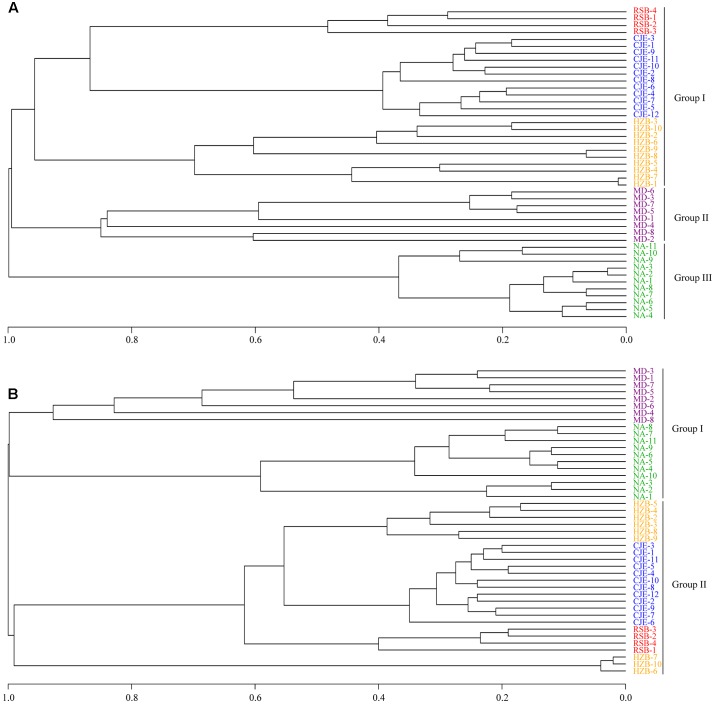
FIGURE 9.
UPGMA clustering of AOA (A) and AOB (B) community compositions in previous studies and in the present study. RSB-∗, CJE-∗, HZB-∗, MD-∗, and NA-∗ indicate sequences from this study, Changjiang Estuary (Xia et al., 2015), Hangzhou Bay (Zhang et al., 2015, 2016), Minami-Daito Island (Hayashi et al., 2015) and Ny-Ålesund (Tago et al., 2015), respectively.

