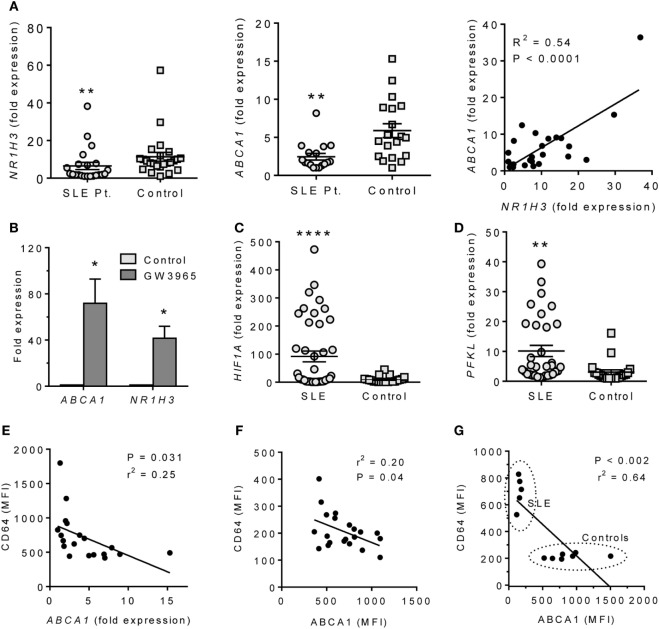
Figure 6.
ABCA1 and HIF1α expression in monocytes from SLE patients. (A) Expression of NR1H3 and ABCA1 in adherent PBMC (Q-PCR) and bivariate analysis of ABCA1 vs. NR1H3 (right). Left **P < 0.01 (Student’s unpaired t-test); Middle, **P < 0.01 vs. control (Welch’s unpaired t-test). (B) Adherent PBMCs were treated with 1 µM GW3965 or vehicle alone (Control) for 24 h. ABCA1 and NR1H3 expression levels were measured by Q-PCR. *P < 0.05 (Welch’s unpaired t-test). (C) Expression of HIF1A in adherent PBMCs from SLE patients vs. healthy controls (Q-PCR). *P < 0.0001 (Welch’s unpaired t-test). (D) PFKL expression on adherent PBMCs from SLE and healthy controls (Q-PCR). *P < 0.01 (Welch’s unpaired t-test). (E) Flow cytometry of the IFN-regulated protein CD64 staining (MFI, flow cytometry) vs. ABCA1 mRNA expression (Q-PCR) in monocytes from unselected SLE patients. (F) Flow cytometry of CD64 (surface staining) vs. ABCA1 (intracellular staining) in monocytes from unselected SLE patients. (G) CD64 vs. ABCA1 staining in PBMCs from five patients with active SLE and seven healthy controls.

