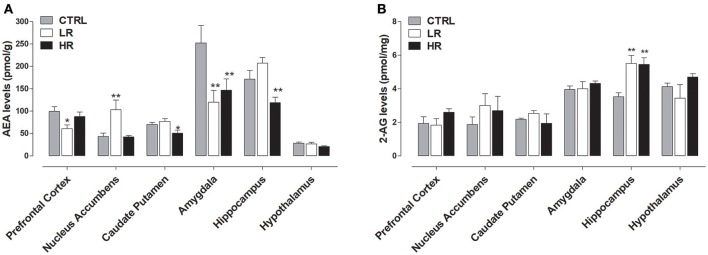
Figure 4.
Endocannabinoid levels: data are presented as mean ± SEM (n = 6 rats per group). (A) AEA: HR group showed a decrease in Caudate Putamen, Amygdala and Hippocampus compared to CTRL group (one-way ANOVA: *P < 0.05 and **P < 0.01, Newman–Keuls test vs. CTRL); LR group showed a decrease in Prefrontal Cortex and Amygdala as well as an increase in the Nucleus accumbens compared to CTRL group (one-way ANOVA: *P < 0.05 and **P < 0.01, Newman–Keuls multiple comparison test vs. CTRL group). (B) 2-AG: both LR and HR groups showed an increase compared to CTRL group in the hippocampus (one-way ANOVA: **P < 0.01, Newman–Keuls test vs. CTRL group).

