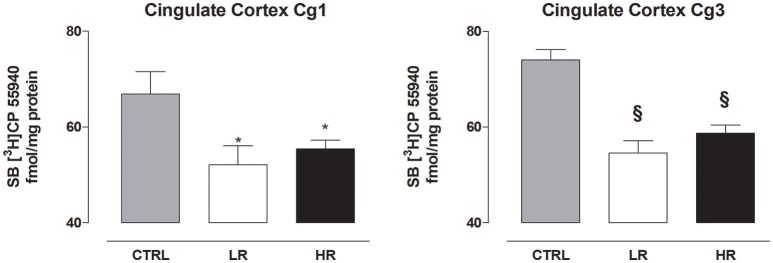
Figure 6.
CB1 receptor density in the cingulate cortex Cg1 and Cg3. Data are expressed as mean fmol/mg protein of [3H]CP55940 ± SEM (n = 6 per group). Both LR and HR groups showed a decrease in the Cg1 and Cg3 compared to CTRL group (one-way ANOVA: *P < 0.05 and §P < 0.001, Newman–Keuls test vs. CTRL group).

