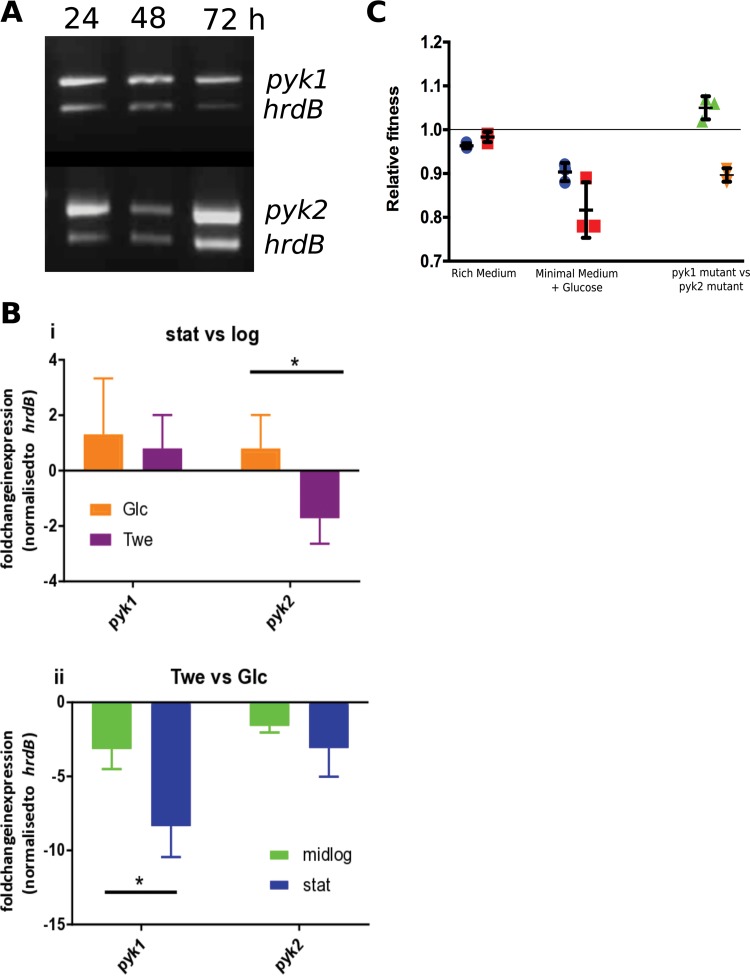
FIG 3 .
(A) Semiquantitative RT-PCR of expression of pyk1, pyk2, and hrdB throughout the life cycle of Streptomyces coelicolor. (B) Fold change expression of pyk1 and pyk2 normalized to hrdB expression from three biological replicates measuring expression levels by qPCR on growth in minimal medium with either glucose or Tween as carbon source during log or stationary phase comparing expression in stationary phase versus log phase (i) and Tween versus glucose (ii). *, P value ≤ 0.05. (C) Fitness of pyk1 (dark blue circles) and pyk2 (red squares) mutants compared to WT and each other (relative to pyk1) in rich medium (green triangles) and minimal medium with glucose (orange inverted triangles) as sole carbon source. Error bars represent the standard deviation from three biological replicates, with the mean indicated. The line (at a relative fitness of 1.0) indicates the fitness of a strain when competed against itself.

