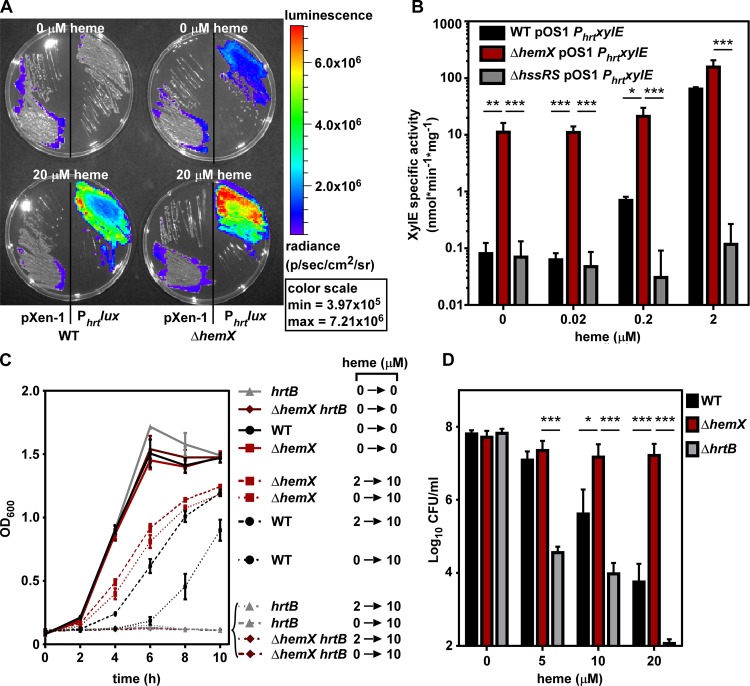
FIG 3 .
Excess heme synthesis in the ΔhemX mutant activates the heme stress response. (A) Bioluminescence was imaged on agar medium plates containing vehicle or heme onto which strains were streaked. All four plates were imaged simultaneously, and luminescence was converted to a heat map with the scale shown on the right. (B) XylE catechol oxidase activity was measured in S. aureus strains after growth in vehicle or increasing concentrations of heme. The data are the average from three independent experiments each in biological triplicate with standard deviation shown. Statistical significance was determined using a two-way ANOVA with Tukey’s correction for multiple comparisons, comparing log-transformed data for the ΔhemX pOS1 PhrtxylE strain at each heme concentration to that of each other strain. *, P < 0.01; **, P < 0.001; ***, P < 0.0001. (C) Growth as measured by OD600 was monitored over time for S. aureus strains in medium containing either vehicle or 10 µM heme. Prior to the measured growth, the strains were pregrown to the stationary phase in medium containing vehicle or 2 µM heme. The data are the average of the means from at least three independent experiments each in biological triplicate with standard error of the mean shown. (D) Viable bacteria from S. aureus strains were enumerated after incubation for 2 h in medium containing vehicle or increasing amounts of heme. The data are the average of the means from three independent experiments each in biological triplicate with standard error of the mean shown. The y axis is set to the limit of detection. Statistical significance was determined using a two-way ANOVA with Tukey’s correction for multiple comparisons, comparing log-transformed data for the WT and ΔhrtB strains to the ΔhemX mutant at each heme concentration. *, P < 0.01; ***, P < 0.0001.

