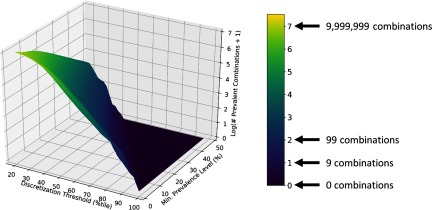
Figure 3.
Surface plot illustrating how the number of prevalent combinations of National Health and Nutrition Examination Survey (NHANES) 2009–2010 Group A chemicals decreases as the chemical concentration discretization threshold and the minimum prevalence level are increased. Here we have used the distributions (or more specifically, certain percentiles) of concentration measurements for individual chemicals to set thresholds for “significant” chemical exposure. For example, a value of 50 on the “discretization threshold” axis implies that a chemical was considered to be present in any subjects for which the concentration exceeded the median, or 50th percentile, concentration for that chemical. It is also important to note that the values for the surface plot were computed by a) computing the number (or count) of prevalent combinations containing at least two elements, b) adding one to this value, and then c) taking the base 10 logarithm of the result. Because of a), we exclude from consideration combinations of chemicals consisting of just one chemical. By performing b), we ensure that all counts are greater than zero so that c) will not fail. Importantly, due to the way we constructed the subject-chemical databases, we can interpret the minimum prevalence level as the minimum percentage of the U.S. population that will test positive for a given combination (a subject is considered to test positive for a combination when his/her concentrations of all chemicals in the combination exceed the chemical concentration discretization threshold). Note that Figure 4A gives a contour plot representation of the same information contained in this surface plot, while Figures 5B and 5C give contour plots corresponding to NHANES 2009–2010 Group B and Group C chemicals, respectively.

