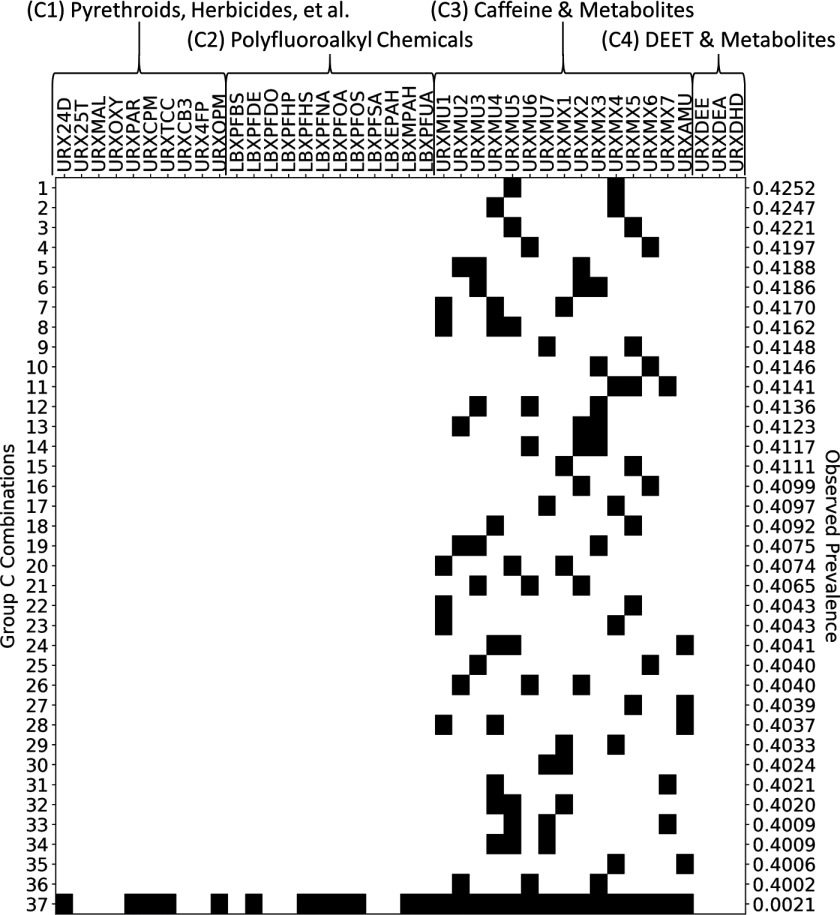
Figure 7.
Presence–absence map (black indicates present) illustrating 36 maximal prevalent combinations of Group C chemicals (rows 1 through 36) and one supercombination consisting of 27 of the 40 chemicals in Group C (row 37). The maximal prevalent combinations were identified using frequent item set mining (FIM) with discretization thresholds set at the 50th percentiles and a minimum prevalence level of 40%. The supercombination occurred in 2 Subsample C subjects, representing a total of 479,033 (or 0.21%) of 226,021,580 represented U.S. residents. NHANES codes along the top of the figure indicate Group C chemicals, and these are organized into subgroups C1, C2, C3, and C4. The observed prevalence number at the right of each row indicates the proportion of U.S. residents in which the given combination was observed to occur.

