. 2017 Aug 24;125(8):087017. doi: 10.1289/EHP1265

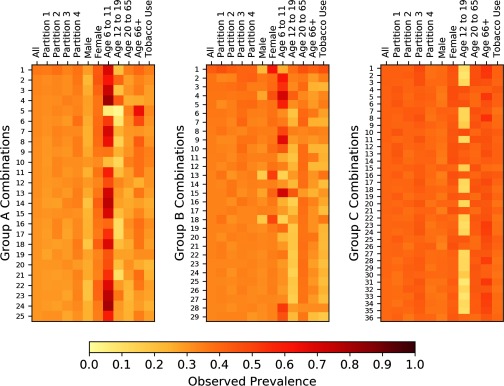
Figure 8.

Three heat maps. The observed prevalence is considered in an entire sample or partitions, namely, Partition 1, Partition 2, Partition 3, and Partition 4, along with demographic subpopulations, namely, males, females, persons aged 6 to 11, 12 to 19, 20 to 65, 66 plus, and persons using tobacco.

Heat maps indicating the observed prevalence of chemical combinations within various partitions and demographic subpopulations. The enumerated combinations for Groups A, B, and C are identical to the enumerated prevalent combinations that are provided in Figure 5, Figure 6, and Figure 7, respectively.