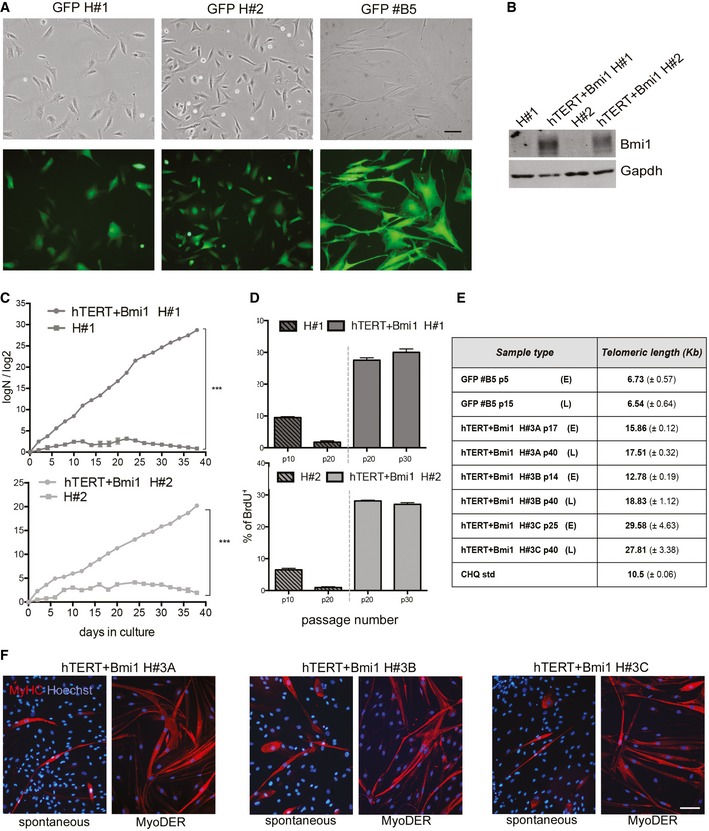
Figure EV2. Characterisation of immortalised mesoangioblasts.

- Phase contrast (upper row) and fluorescence (lower row) of GFP H#1 and H#2 polyclonal populations and of GFP #B5 clone (from GFP H#3 polyclonal population). Scale bar: 100 μm.
- Western blot showing Bmi1 expression for hTERT + Bmi1 polyclonal populations (hTERT + Bmi1 H#1 and hTERT + Bmi1 H#2) and untransduced parental population (H#1 and H#2). Gapdh: normaliser.
- Population doubling curves (PD = logN/log2; N = number of initially plated cells/number of collected cells) of untransduced and hTERT + Bmi1 mesoangioblasts derived from healthy donor #1 (H#1) and #2 (H#1). Data expressed as means ± SEM (n = 2). ***P = 0.0001 (H#1), ***P = 0.0007 (H#2), unpaired two‐tailed t‐test performed on last time point.
- Bar graph showing proliferation rate of untransduced (on the left of the dashed line) and hTERT + Bmi1 (on the right of the dashed line) mesoangioblasts derived, respectively, from healthy donor #1 (H#1) and healthy donor #2 (H#2). Proliferation rate was assessed as the percentage BrdU+ cells on total number of nuclei. Data are expressed as means ± SEM (n = 2).
- Quantification of TRF assay shown in Fig 3I. Data expressed as means ± SD (n = 3).
- Immunofluorescence analysis of hTERT + Bmi1 clones H#3A, H#3B and H#3C spontaneous (left) and MyoD‐ER‐mediated (right) skeletal muscle differentiation. Red: myosin heavy chain (MyHC); blue: Hoechst. Scale bar: 50 μm.
Source data are available online for this figure.
