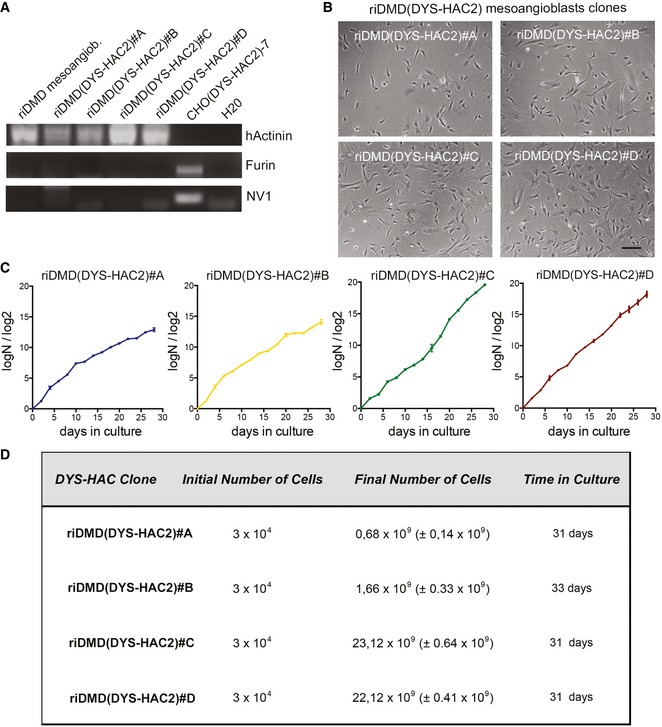
Figure EV3. Characterisation of riDMD(DYS‐HAC2) mesoangioblast clones.

- PCRs for human actinin, hamster furin and hamster NC1 genes on riDMD(DYS‐HAC2) mesoangioblasts clones.
- Phase contrast morphology of riDMD(DYS‐HAC2) mesoangioblasts clones riDMD(DYS‐HAC2)#A, riDMD(DYS‐HAC2)#B, riDMD(DYS‐HAC2)#C and riDMD(DYS‐HAC2)#D. Scale bar: 100 μm.
- Proliferation curves of riDMD(DYS‐HAC) mesoangioblast clones (PD = logN/log2; N = number of initially plated cells/number of collected cells). Data are expressed as means ± SEM (n = 2).
- Numbers of cells obtained in 31 days of culture for riDMD(DYS‐HAC2) mesoangioblast clones starting from 3 × 10⁴ plated cells. Data are expressed as means ± SEM (n = 2).
Source data are available online for this figure.
