
Figure 2. Unlike 3×mAbs, osimertinib induces apoptosis of erlotinib‐resistant NSCLC cells.
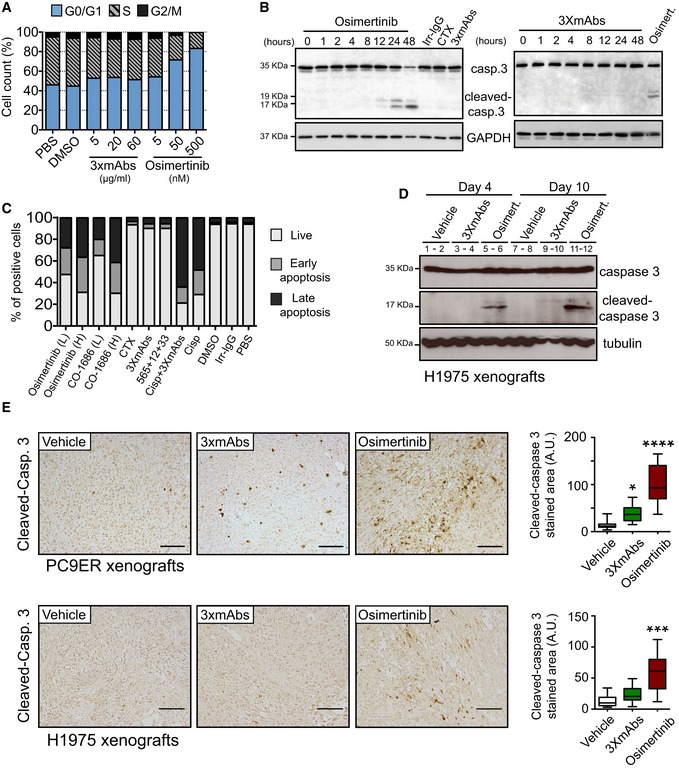
- PC9ER cells were treated for 24 h with increasing concentrations of 3×mAbs or osimertinib, or with the respective vehicles (saline or DMSO). Following incubation with BrdU (60 min), cells were fixed and subjected to BrdU and PI staining. Shown are cell cycle distributions of one representative experiment that used cytometry and 100,000 cells/sample. The experiment was repeated three times.
- PC9ER cells were treated for the indicated time intervals with osimertinib (0.5 μM) or 3×mAbs (TRZ, CTX, and mAb 33; each at 20 μg/ml). Alternatively, cells were treated for 48 h with an irrelevant immunoglobulin G (Irr‐IgG), cetuximab (CTX, 20 μg/ml), osimertinib, or 3×mAbs. Cell extracts were prepared, electrophoresed, and immunoblotted for caspase‐3 and its cleaved form. The locations of caspase‐3 and two cleaved forms are indicated. GAPDH was used as an equal loading control. Blots are representative of two experiments.
- PC9ER cells were treated for 48 h with the following agents: saline (PBS), cetuximab (CTX, 20 μg/ml), 3×mAbs (CTX, TRZ, and mAb33, each at 20 μg/ml), osimertinib, CO‐1686, cisplatin (1 μM), and a mixture of 3×mAbs and cisplatin. Shown are results of an apoptosis assay performed using an annexin V/7‐AAD kit (BioLegend, Inc.). Quantification of the fractions of early and late apoptotic cells is shown (see Fig EV2B). L, low drug concentration (0.01 μM); H, high drug concentration (0.5 μM). The experiment was repeated three times.
- Mice bearing H1975 tumor xenografts were treated for the indicated time interval with either vehicle, 3×mAbs (0.2 mg/mouse/dose), or with osimertinib (5 mg/kg/dose). Whole tumor extracts were immunoblotted for caspase‐3. Note that each lane represents a single tumor.
- Immunohistochemical staining for cleaved caspase‐3 performed on paraffin‐embedded sections derived from xenografts of either PC9ER or H1975 cells. Two weeks after tumor inoculation, mice were randomized (3–4 mice/group) and treated for 12 days either with vehicle, 3×mAbs (CTX, TRZ, and mAb33; 0.2 mg/mouse/injection, once every 3 days), or osimertinib (5 mg/kg/injection, once daily). Shown is immunohistochemical staining for the cleaved form of caspase‐3 in paraffin‐embedded sections. Scale bars, 100 μm. Also shown is a box and whisker analysis (note that the ends of the box are the upper and lower quartiles and the median is marked by a line inside the box) of the results obtained in three different experiments. ****P < 0.0001; ***P < 0.001; *P < 0.05; n = 3; one‐way ANOVA, with Tukey's test.
Source data are available online for this figure.