-
A
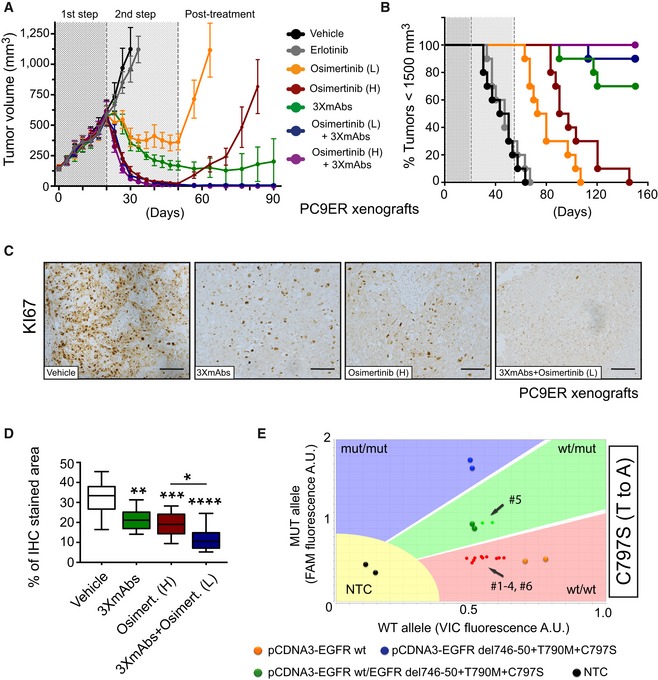
PC9ER cells (3 × 10⁶ cells per animal) were implanted in the flanks of CD1‐nu/nu mice. Once palpable tumors emerged, mice were daily treated with erlotinib (50 mg/kg/dose; 1st step). Following randomization of mice, we started the following arms of second step treatment: (1) vehicle control, (2) erlotinib, (3 and 4) osimertinib (1 or 5 mg/kg/dose; L or H, respectively), (5) the triple antibody combination, which was injected intraperitoneally once every 3 days, (6 and 7) and combinations of 3×mAbs (0.2 mg/mouse/dose) and osimertinib, either high or low. All treatments were stopped on day 50, but we continued monitoring tumor volumes (post‐treatment phase). Data are means ± SEM from 9 to 10 mice of each group.
-
B
Kaplan–Meier survival analysis of the tumor‐bearing mice shown in (A). Mice were euthanized when tumor volumes reached 1,500 mm3.
-
C, D
One week after inoculation of PC9ER cells, mice were randomized (4 mice/group) and treated for 14 days as described in (A) (arms 1, 4, 5, and 7). Shown is immunohistochemical staining for KI67 in paraffin‐embedded sections using specific antibodies. Scale bars, 100 μm. Also shown are box and whisker plots (note that the ends of the box are the upper and lower quartiles and the median is marked by a line inside the box) depicting quantifications of KI67 staining. *P < 0.05; **P < 0.01; ***P < 0.001; ****P < 0.0001; n = 6; one‐way ANOVA with Tukey's test.
-
E
Genomic DNA, along with the indicated plasmid DNA reference samples, were tested for EGFR's T790M and C797S mutations using the TaqMan genotyping assay. DNA was isolated from six relapsing tumors, all from mice treated with osimertinib (high dose; arm 4 in panel A). Fluorescent signals corresponding to individual tumors and mice are shown as small colored dots, whereas large dots represent signals obtained from plasmid DNA. Note that VIC‐labeled primers were used for amplification of wild‐type alleles, whereas FAM‐labeled primers were used for the mutant alleles. As indicated, only one animal, mouse number 5 (#5), scored positive for a mutant C797S allele. Data were analyzed using TaqMan Genotyper Software (Life technologies). NTC, no‐template control.

