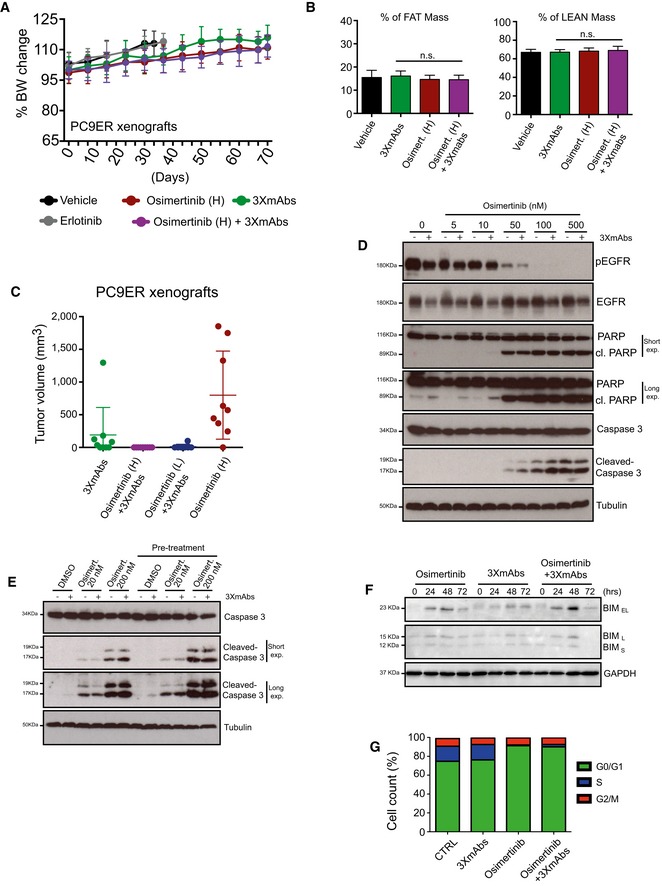
Figure EV4. Cooperative anti‐tumor effects of the combination of osimertinib and 3×mAbs.

- Comparison of body weights (averages ± SD) of groups of eight CD1‐nu/nu mice harboring PC9ER xenografts, which were treated with either erlotinib (50 mg/kg/day), osimertinib (High; 5 mg/kg/day), or a mixture of three mAbs (3×mAbs; CTX, TRZ, and mAb33; 0.2 mg/mouse/injection). Note that TKIs were daily administered using oral gavage, whereas the triple antibody combination was injected intraperitoneally once every 3 days.
- Shown are results of body mass composition analyses (mean ± SD) of the fraction of fat mass (left) and lean mass (right) on day 20 of treatment. Mice harboring no tumors were used as an internal control.
- Nude mice harboring PC9ER tumor xenografts were treated with osimertinib and 3×mAbs. The dot plot presents tumor volumes determined 83 days after the beginning of treatments. Note that each symbol represents a single animal. Data are means (± SD) from 9 to 10 mice per group. The experiment was performed once and each arm included 8–10 mice. The horizontal bars indicate medians and the upper and lower quartiles.
- PC9ER cells were treated for 24 h with the indicated concentrations of osimertinib, either alone or in combination with 3×mAbs (CTX, TRZ, and mAb33; 30 μg/ml). Cell extracts were prepared, electrophoresed, and immunoblotted for EGFR, phospho‐EGFR (Y1068), caspase‐3 and cleaved caspase‐3, PARP, and its cleaved forms. Tubulin was used as an equal loading control. Blots are representative of two experiments. The cleaved forms (cl.) of PARP and caspase‐3 are indicated, along with the corresponding molecular weight markers.
- PC9ER cells were pre‐treated for 11 days with 3×mAb (30 μg/ml). Thereafter, both pre‐treated cells and control cells were incubated for 24 h with 3×mAbs (20 μg/ml), either in the absence or in the presence of the indicated concentrations of osimertinib. Whole‐cell extracts were probed for caspase‐3 and its cleaved form (cleaved caspase‐3). “Long exp.” refers to a longer film exposure aimed at enhancing the signals. Tubulin served as an equal loading control.
- PC9ER cells were treated with osimertinib (500 nM), 3×mAbs (20 μg/ml), or with the respective combination for the indicated time intervals. Cell extracts were subjected to immunoblotting with anti‐BIM antibodies. GAPDH was used as a loading control. The three forms of BIM are indicated, along with the corresponding molecular weight markers.
- PC9ER cells were treated for 24 h with 3×mAbs (30 μg/ml), osimertinib (500 nM), or a combination of the two treatments. DMSO was used as a control treatment (CTRL). Following incubation with BrdU (60 min), cells were fixed and subjected to BrdU and PI staining. Shown are cell cycle distributions of a representative experiment performed on 200,000 cells/sample using cytometry. The experiment was repeated twice.
Source data are available online for this figure.
