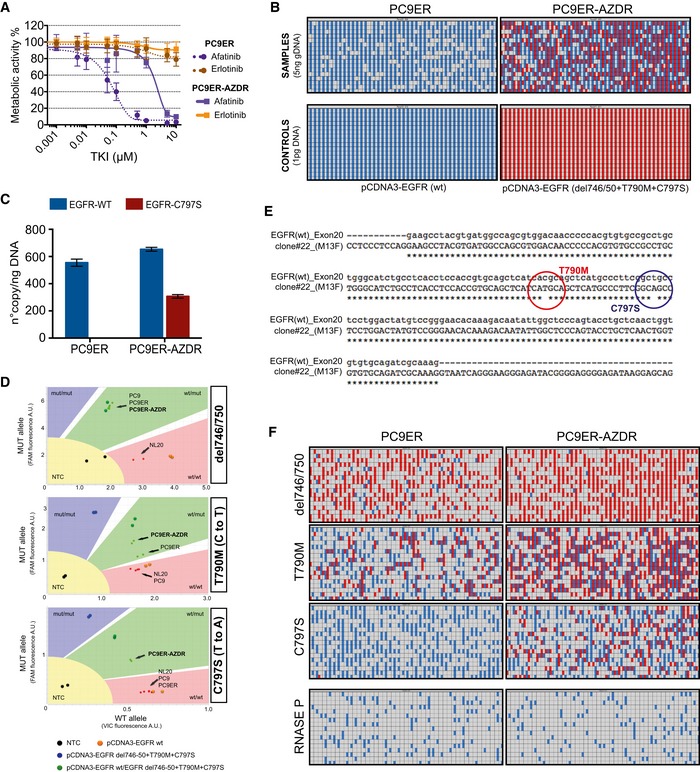
Shown are survival assays of PC9ER and derivative PC9ER‐AZDR cells, which were selected in vitro for resistance to osimertinib. Cells were treated for 72 h with increasing concentrations of erlotinib or afatinib, and MTT signals were determined. Data are means ± SD values of three independent experiments.
Genomic DNA was isolated from PC9ER and from PC9ER‐AZDR cells and then subjected to dPCR analysis using the Fluidigm Biomark platform. Thereafter, DNA stocks were diluted to 10 ng/μl. In parallel, DNA was isolated from control pcDNA3 plasmids, encoding either wild‐type EGFR or the triple mutant del746/50, T790M, and C797S. Five serial dilutions of the two genomic DNA samples were prepared and loaded onto the dPCR chip, side by side with DNA from plasmids (1 pg). The results obtained with one serial dilution (5 ng DNA) and C797S‐specific primers are presented alongside the results from control plasmids. Analysis was performed utilizing dPCR software from Fluidigm. Amplifications with mutation positive and mutation negative wells appear in red and in blue, respectively.
Histograms depicting results of digital PCR (dPCR) analysis performed three times with genomic DNA isolated from PC9ER and PC9ER‐AZDR cells. Average numbers of copies per 1 ng of genomic DNA (± SD) were obtained from serial dilutions of DNA.
The TaqMan genotyping assay was applied on genomic DNA isolated from PC9, PC9ER, and PC9ER‐AZDR cells. As reference, we used DNA from normal human lung epithelial cells (NL20), along with a plasmid DNA encoding EGFR harboring the indicated mutations. Fluorescent signals corresponding to cellular DNA samples are shown as small colored dots, whereas the larger dots represent signals obtained from plasmid DNAs. Note that VIC‐labeled primers were used for amplification of wild‐type alleles, whereas FAM‐labeled primers were used for the mutant alleles. Each sample was run in duplicates. Data were analyzed using TaqMan Genotyper Software (Life technologies). As indicated, PC9ER‐AZDR cells scored positive for three mutant alleles: del746/750, T790M, and C797S. NTC, no‐template control.
Genomic DNA was extracted from PC9ER‐AZDR cells. The region corresponding to EGFR's exon 20 was sequenced and aligned with the WT sequence. Note that the C to T (T790M) mutation (red) and the T to A (C797S) mutation (blue) are allelic.
Genomic DNA isolated from PC9ER and from PC9ER‐AZDR cells was subjected to dPCR analysis using the Fluidigm Biomark platform (gDNA, 2.5 ng/sample). Exact copy number of the indicated EGFR mutated alleles, as well as the WT alleles, was then assessed. The RNase P specific set of probes was used as normalizer. The analysis was performed utilizing the dPCR software from Fluidigm. Amplifications with mutation positive and mutation negative wells appear in red and in blue, respectively.

