
Figure 1. Overall survival from start of therapy.
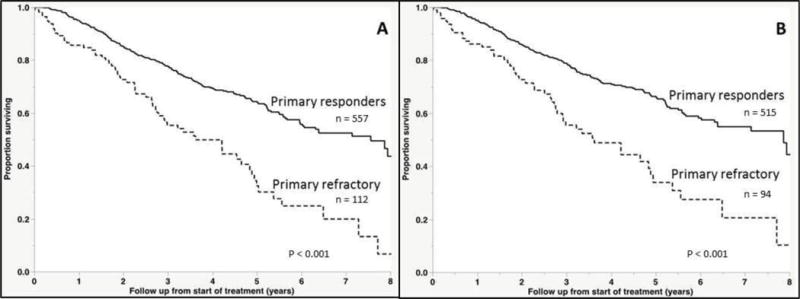
(A) Kaplan-Meier curves demonstrating differences in overall survival between responders and non-responders to induction therapy in the entire cohort. (B) Overall survival excluding those who did not receive a novel agent with induction.