
Figure 2. Overall survival in landmark investigation.
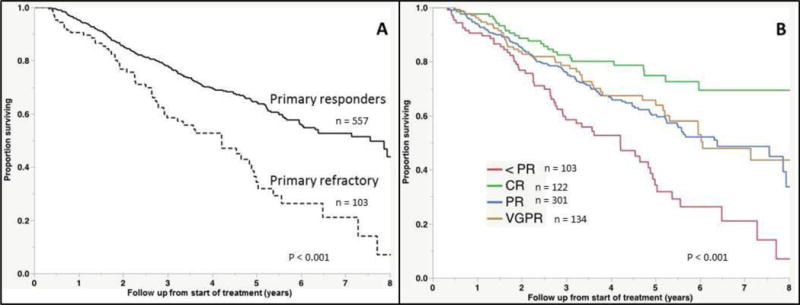
(A) Kaplan-Meier curves demonstrating differences in overall survival between responders and non-responders to induction therapy, including only those who were alive at four months after start of treatment. (B) Overall survival in landmark investigation, with groups separated according to depth of response.