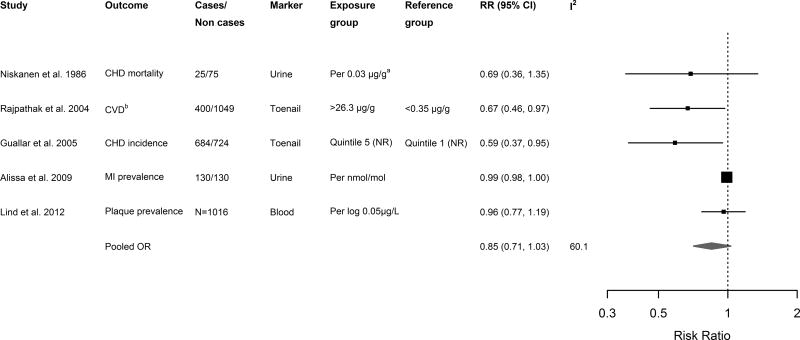
Figure 2. Relative risks (RRs) for cardiovascular disease endpoints for a given change in chromium level.
Squares and diamonds represent effect estimates and are proportional to the inverse of the variance of the log odds ratios, and lines represent 95% CIs. a Niskanen et al. only reported mean levels of urinary Cr among cases and controls; we derived RR and 95% CI via the linear discrimination method [157]. Abbreviations: NR, not reported; CHD, coronary heart disease; MI, myocardial infarction. Total N was reported where number of cases/non cases was not available. Pooled estimates within and across studies were pooled via inverse-variance weighted random effects.

