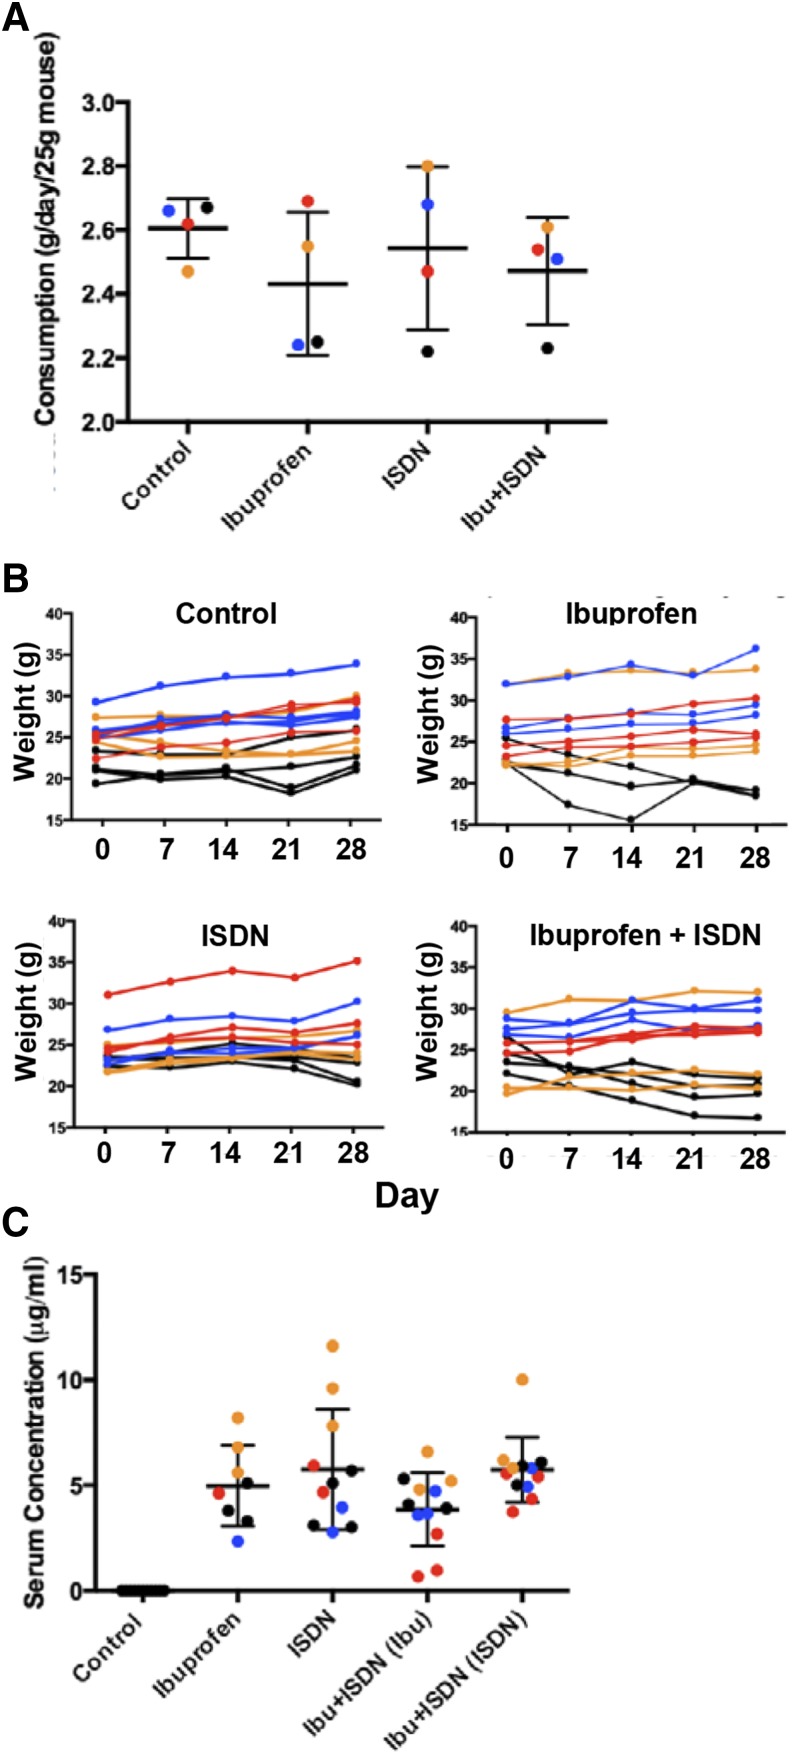
Fig. 1.
Dosing A/J mice with ibuprofen and ISDN in the chow. Data are displayed in color to indicate each of the studies we performed. Red, cohort 1; blue, cohort 2; orange, cohort 3; black, cohort 4. Please consult Table 1 for the concentrations of drugs used in each. (A) Food consumed per mouse per day (mean ± S.D.). (B) Body weights of mice by diet type, plotted for individual mice. Data are expressed as mean ± S.D. (C) Scattergram of drug concentrations measured in the serum of treated and control A/J mice. The ibuprofen concentrations in mice that were dosed simultaneously with ISDN, and the ISDN concentrations in mice dosed simultaneously with ibuprofen, are given separately. Control values are negligible. The y-axes in (A and B) are curtailed. See Materials and Methods for details.

