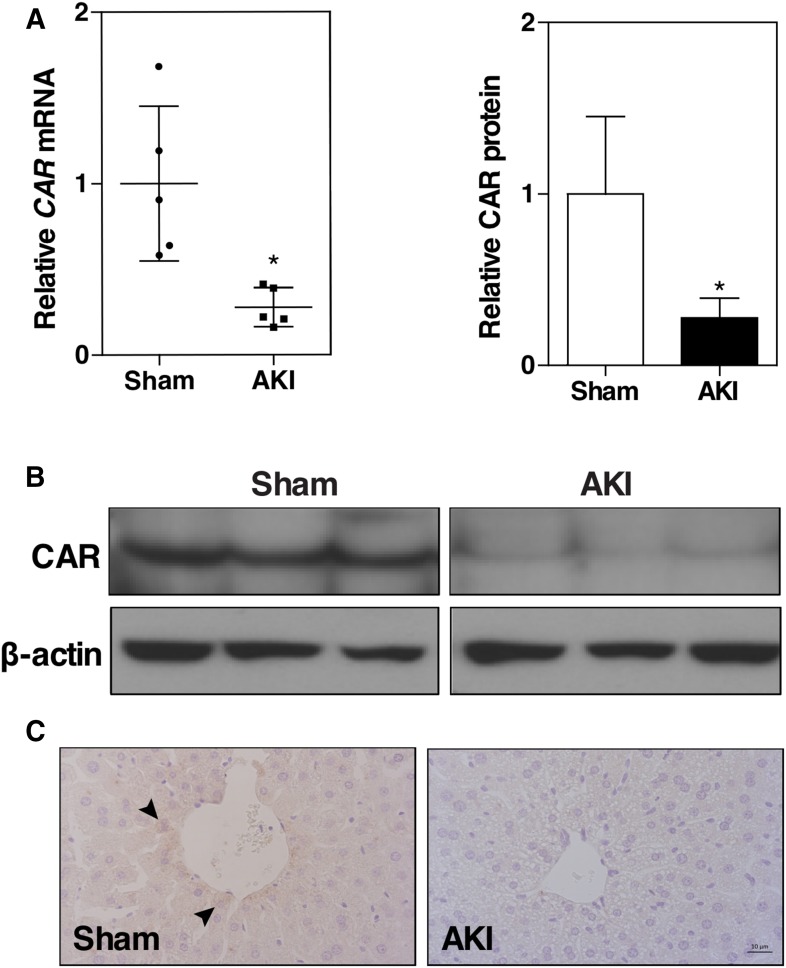
Fig. 2.
Renal IR decreases the hepatic expression of CAR. Mice were the same as described in Fig. 1. (A) Liver CAR mRNA expression was measured by quantitative real-time PCR. The relative gene levels are represented as fold change compared with the sham group. Results are presented as the mean ± S.D. of five mice per group. *P < 0.05, compared with the sham group. (B) Liver CAR protein expression was measured by Western blotting. Lanes represent individual mice. Shown on the top right is the densitometric quantification of the Western blotting results. (C) Liver CAR protein expression was detected by immunohistochemistry. Arrowheads indicate positive staining.

