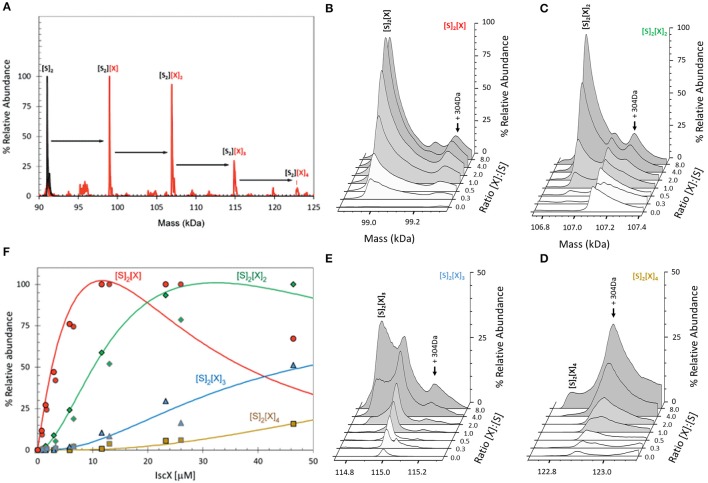
Figure 3.
ESI-MS investigation of complex formation between IscS and IscX. (A) Deconvoluted mass spectrum of IscS over the mass range 90–125 kDa, showing the presence of the IscS dimer (black spectrum). Addition of IscX at an 8:1 excess gave rise to a series of IscX-IscS complexes in which the IscS dimer is bound by 1–4 IscX protein molecules (red spectrum). (B–E) Deconvoluted mass spectra at increasing ratios of IscX to IscS showing the formation/decay of the four IscX-IscS complexes, as indicated. A +340 Da adduct species is present in each of the spectra, including that of the IscS dimer, indicating that it originates from IscS. The precise nature of the adduct is unknown, but it is likely to arise from two β-mercaptoethanol hetero-disulfides per IscS (4 × 76 = 304 Da), as the protein is in a solution containing 20 mM β-mercaptoethanol. (F) Plots of relative intensity of the four IscX-IscS complexes, as indicated, as a function of IscX concentration. Solid lines show fits of the data to a sequential binding model for 1–4 IscX per IscS dimer. IscS (3 μM) was in 250 mM ammonium acetate, pH 8. Note that abundances are reported relative to the most abundant species, which is arbitrarily set to 100%.

