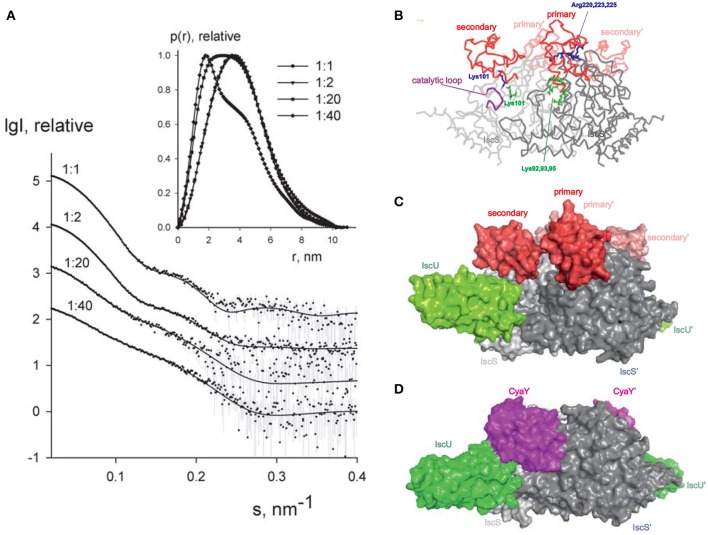
Figure 5.
SAXS measurements. (A) X-ray scattering patterns for IscX-IscS at molar ratios of 1:1 (at 5 mg/ml solute concentration), 2:1 (at 3 mg/ml), 20:1 and 40:1 (both at 0.5 mg/ml). The experimental data are displayed as dots with error bars. The scattering from a mixture of two rigid body models (1:1 and 2:1 IscX-IscS complexes) obtained by SASREFMX (for data with 1:1 molar ratio) and the fits by mixtures of unbound IscX, IscS dimers, and 1:1/2:1 rigid body complexes (for data at 2:1, 20:1, and 40:1 molar ratios) as obtained by OLIGOMER are shown by solid lines. The plots display the logarithm of the scattering intensity as a function of the momentum transfer. The distance distribution functions are indicated in the insert. (B) Backbone representation of the 2:1 IscX-IscS complex. The two IscS protomers are shown in different shades of gray. Residues which are either involved in cross-linking or have an effect on binding are indicated. The catalytic loop of IscS is indicated in purple. (C) Same as in (B) in a full atom representation. For reference, IscU (in green) is included (3LVL) to clarify the relative positions of the components. (D) Comparison with the model previously obtained for the ternary complex CyaY-IscS-IscU (Shi et al., 2010). Light and dark gray represent each of the protomers of the IscS dimer.

