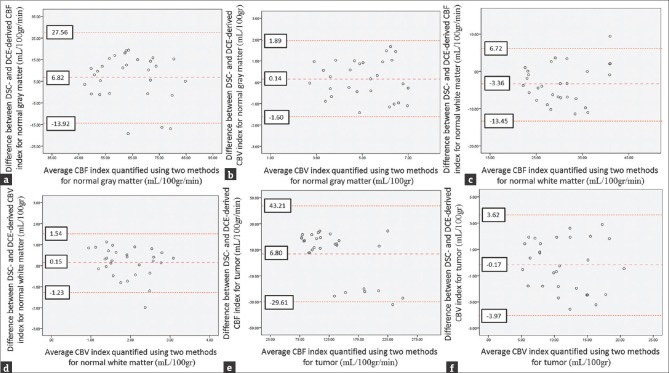
Figure 4.
Bland–Altman plots of dynamic susceptibility contrast- and dynamic contrast-enhanced-derived cerebral hemodynamic indices for tumor and normal gray and white matters. (a) Bland–Altman plots of dynamic susceptibility contrast- versus dynamic contrast-enhanced-derived cerebral blood flow for normal gray matter. (b) Bland–Altman plots of dynamic susceptibility contrast- versus dynamic contrast-enhanced-derived cerebral blood volume for normal gray matter. (c) Bland–Altman plots of dynamic susceptibility contrast- versus dynamic contrast-enhanced-derived cerebral blood flow for normal white matter. (d) Bland–Altman plots of dynamic susceptibility contrast- versus dynamic contrast-enhanced-derived cerebral blood volume for normal white matter. (e) Bland–Altman plots of dynamic susceptibility contrast- versus dynamic contrast-enhanced-derived cerebral blood flow for tumor tissues. (f) Bland–Altman plots of dynamic susceptibility contrast- versus dynamic contrast-enhanced-derived cerebral blood volume for tumor tissues. The middle line is the mean difference and the two extreme lines are the limits of agreement.

