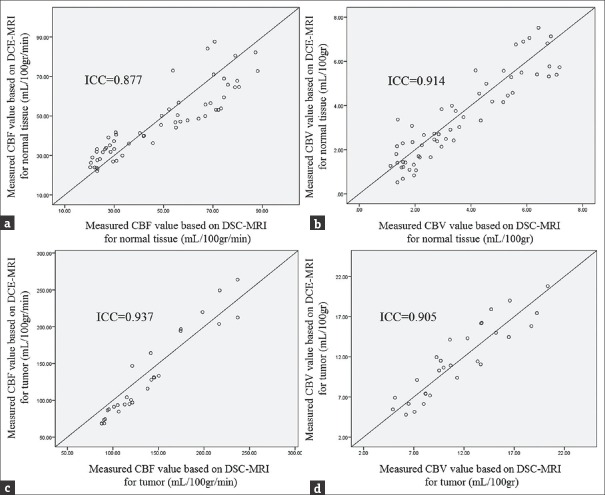
Figure 5.
(a) The scatterplot of dynamic susceptibility contrast- and dynamic contrast-enhanced-derived cerebral blood flow for normal brain tissues. (b) The scatterplot of dynamic susceptibility contrast- and dynamic contrast-enhanced-derived cerebral blood volume for normal brain tissues. (c) The scatterplot of dynamic susceptibility contrast- and dynamic contrast-enhanced-derived cerebral blood flow for tumor tissues. (d) The scatterplot of dynamic susceptibility contrast- and dynamic contrast-enhanced-derived cerebral blood volume for tumor tissues. For each scatterplot, the equality line was plotted to demonstrate the agreement of the indices, and the intraclass correlation coefficient was expressed.

