
Figure 2.
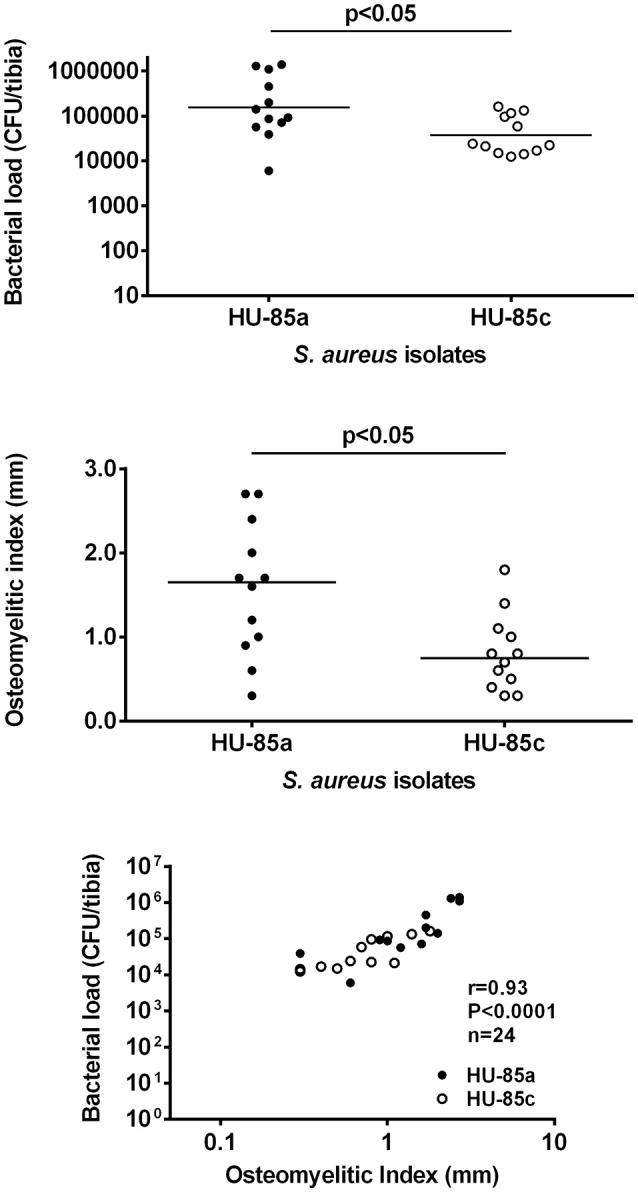
CFU/tibia (upper) and OI (middle) from rats infected with strains HU-85a and HU-85c. Bacterial loads and OI were measured 14 weeks after intratibial challenge. The sample size was n = 9 (HU-85a) and n = 12 (HU-85c), in both panels. The scattergram bars in the upper and middle panels represent the medians. The levels of significance are shown on the charts (Mann-Whitney test). The lower panel shows the correlation of the CFU/bone counts and the OI of all the rats included in the experiments shown in the upper and middle panels (experiment quality control).