Fig. 3.

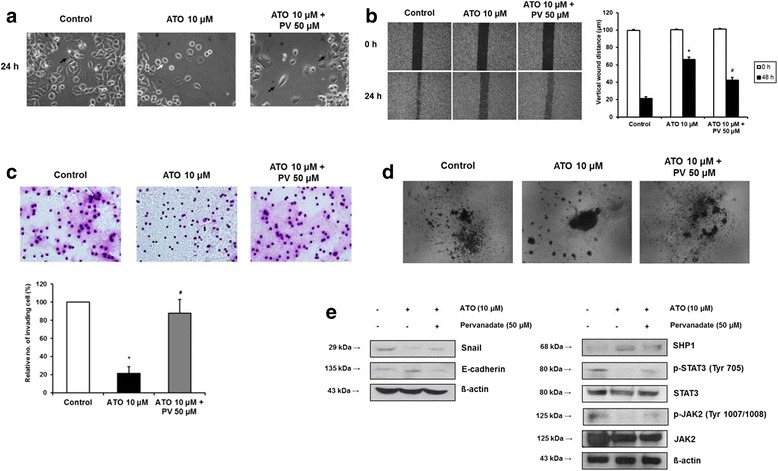
Effects of ATO on AGS cells were reversed by phosphatase inhibitor. a. Phase contrast microscopy. All images were obtained at a magnification of × 100. b. Wound closure assay. Left panel; representative images of wound closure. Right panel; analysis of vertical wound distance. Data are presented as mean ± standard deviation. All experiments were performed in triplicate. *P < 0.05, compared with control; #P < 0.05, compared with ATO 10 μM (n = 3). c. Matrigel invasion assay. Left panel; representative images of Matrigel invasion assay. Right panel; analysis of invading cells. The number of positive invading cells was counted under × 20 magnification. Data are presented as mean ± standard deviation. Cell counting was performed in at least 5 randomly selected separate areas. *P < 0.05, compared with control; #P < 0.05, compared with ATO 10 μM (n = 5). d. 3-D culture spheroid cell invasion assay. Images were taken 7 days after resuspension of AGS cells in spheroid formation extracellular matrix, and adding invasion matrix and medium containing invasion modulating compounds. e. Western blotting. Whole cell lysate protein was extracted after 24 h ATO treatment with or without pretreatment with 50 μM pervanadate for 1 h. β-actin was used as an internal loading control
