
Figure 3. Histological characterization of Dnajb1–Prkaca elicited mouse FL-HCC.
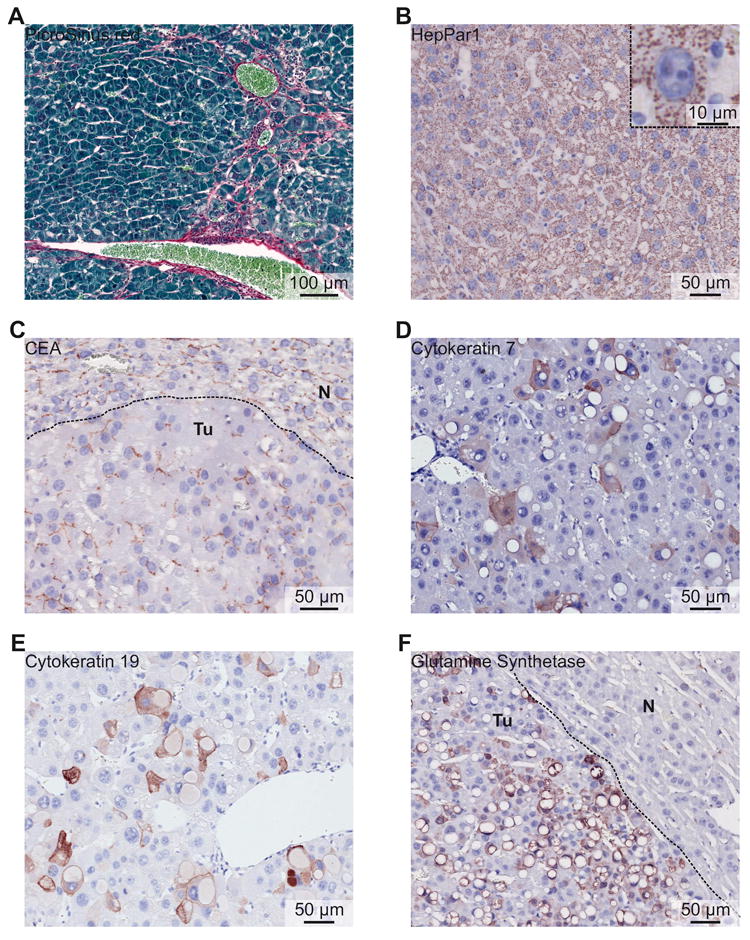
(A) PicroSirius red staining showing mild collagen fibrosis between tumor cells. (B) Tumor cells express HepPar1. (Inset) Detail of a tumor cell expressing HepPar1 with mitochondrial localization and illustrating the mitochondria-rich cytoplasm. (C) Carcinoembryonic antigen (CEA) staining showing canalicular distribution in tumor area (Tu), as well as in normal liver area (N). (D) Cytokeratin 7 expression in tumor area. (E) Cytokeratin 19 expression in tumor area. (F) Broad expression of glutamine synthetase by tumor cells (Tu), but not by hepatocytes of the normal liver area (N).